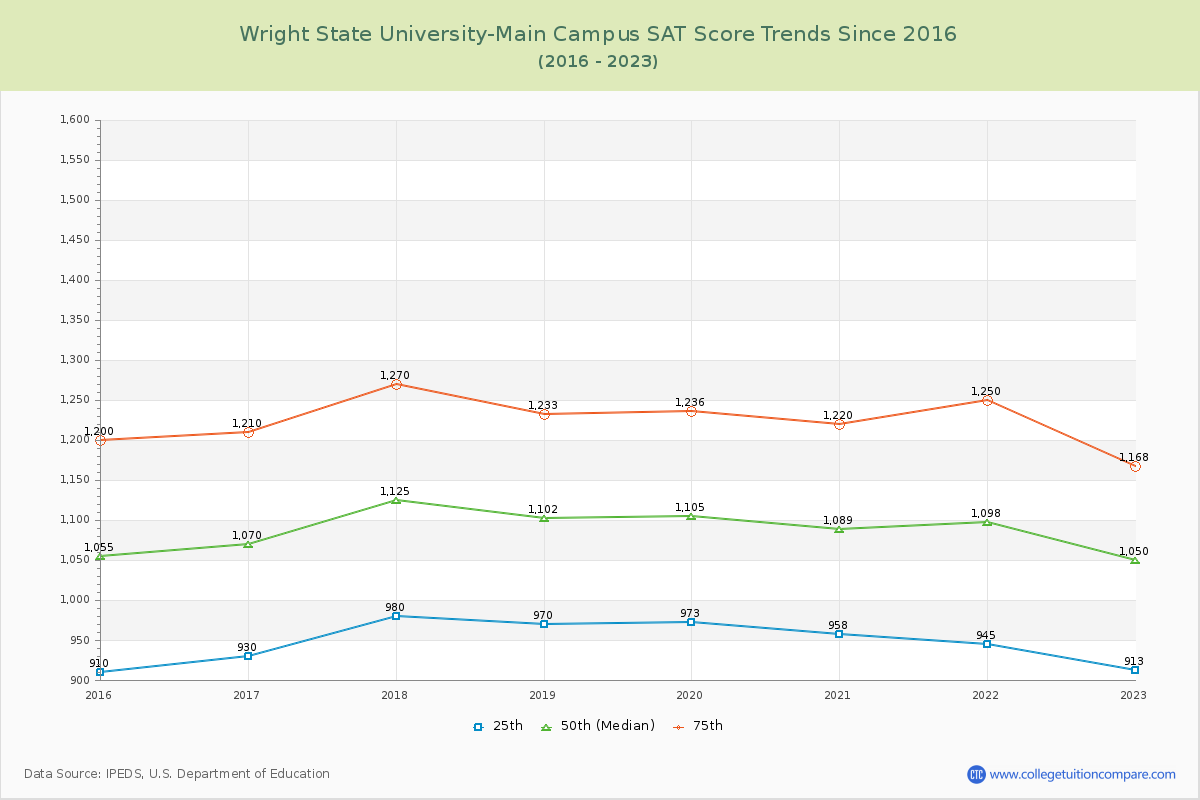
SAT Scores Over Time
The 2023 SAT score is 1050 at Wright State University-Main Campus. Over the past 9 years, the average SAT score is 947 (25th percentile) and 1223 (75th percentile). Compared to similar schools, the submitted SAT scores are around national average at Wright State University-Main Campus.
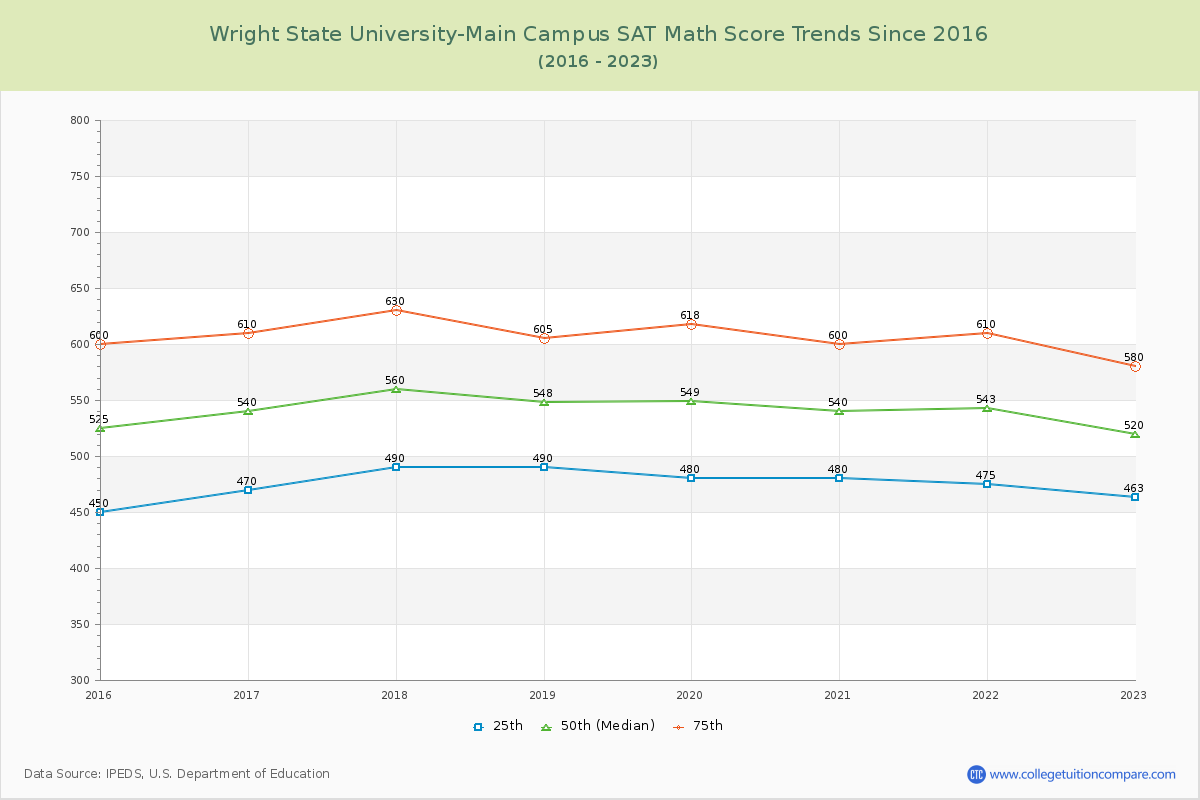
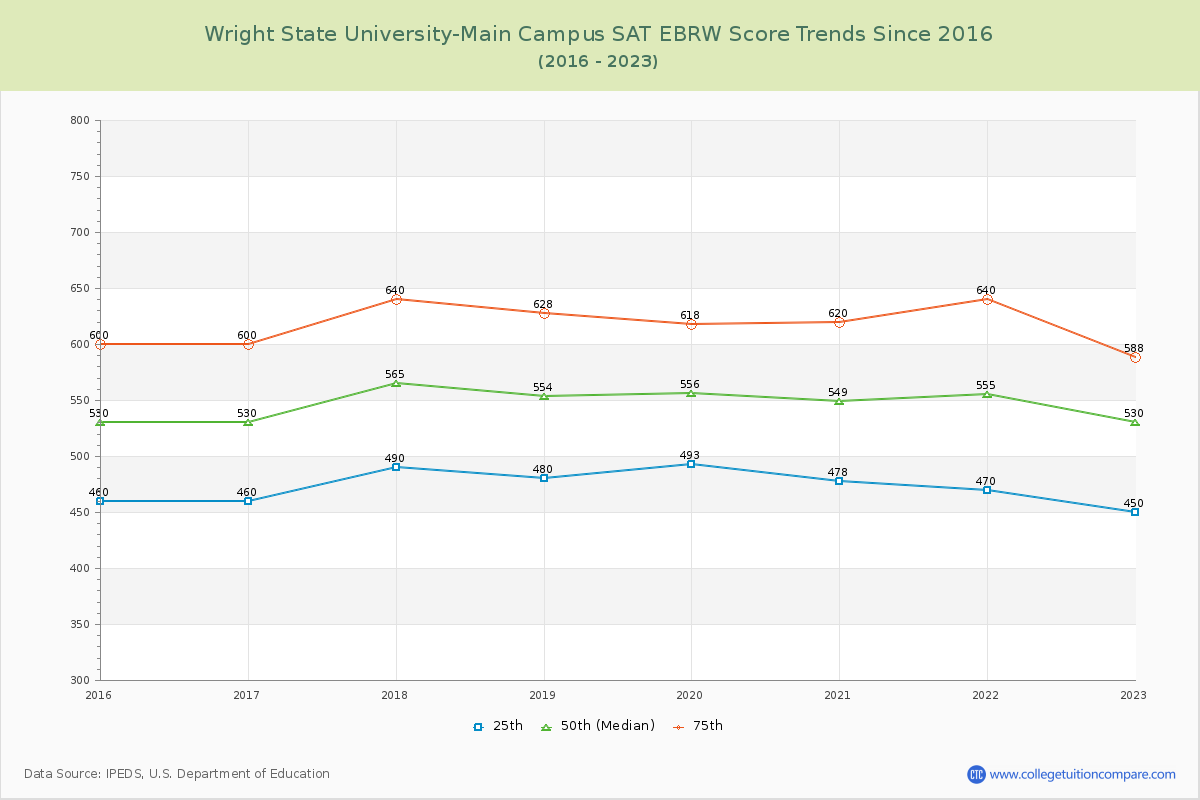
The following table and chart illustrate the changes in SAT scores at Wright State University-Main Campus since 2015.
| Year | Total | Math | Evidence-Based Reading and Writing | ||||||
|---|---|---|---|---|---|---|---|---|---|
| 25th | 50th | 75th | 25th | 50th | 75th | 25th | 50th | 75th | |
| 2015-16 | 910 | 1,055 | 1,200 | 450 | 525 | 600 | 460 | 530 | 600 |
| 2016-17 | 930 | 1,070 | 1,210 | 470 | 540 | 610 | 460 | 530 | 600 |
| 2017-18 | 980 | 1,125 | 1,270 | 490 | 560 | 630 | 490 | 565 | 640 |
| 2018-19 | 970 | 1,102 | 1,233 | 490 | 548 | 605 | 480 | 554 | 628 |
| 2019-20 | 973 | 1,105 | 1,236 | 480 | 549 | 618 | 493 | 556 | 618 |
| 2020-21 | 958 | 1,089 | 1,220 | 480 | 540 | 600 | 478 | 549 | 620 |
| 2021-22 | 945 | 1,098 | 1,250 | 475 | 543 | 610 | 470 | 555 | 640 |
| 2022-23 | 913 | 1,050 | 1,168 | 463 | 520 | 580 | 450 | 530 | 588 |
| Average | 947 | 1087 | 1223 | 475 | 541 | 607 | 473 | 546 | 617 |
*SAT Evidence-Based Reading and Writing replaces SAT critical reading and writing since year 2017.
**The SAT Writing score is excluded from the total scores for year from 2011 to 2016.