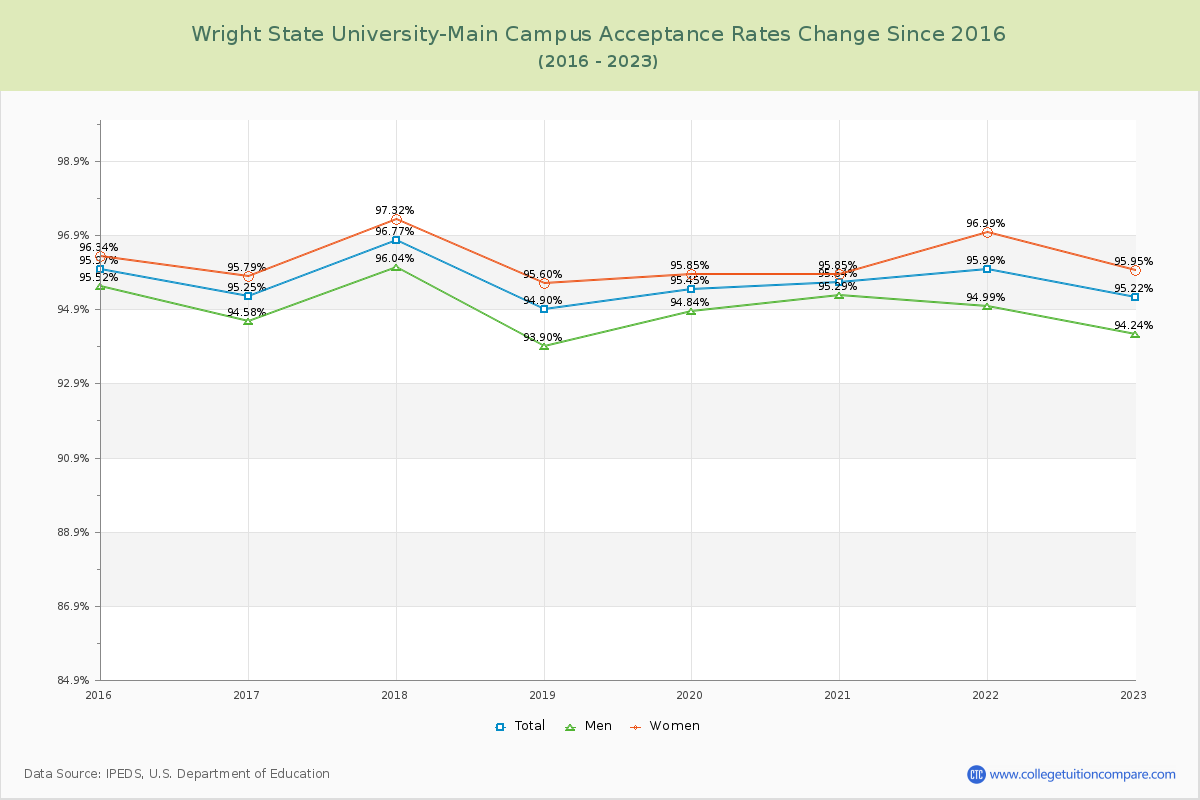
Acceptance Rate Changes
The average acceptance rate over the last 10 years is 95.65%, and this year's acceptance rate is 95.22% at Wright State University-Main Campus. By gender, men students' acceptance rate is 94.92% and women students' rate is 96.21%.
The next table and chart illustrate the acceptance rates changes at Wright State University-Main Campus over the past 8 years (2015-2023).
| Year | Total | Men | Women |
|---|---|---|---|
| 2015-16 | 95.97% | 95.52% | 96.34% |
| 2016-17 | 95.25% -0.72% |
94.58% -0.54% |
95.79% -0.54% |
| 2017-18 | 96.77% 1.53% |
96.04% 1.53% |
97.32% 1.53% |
| 2018-19 | 94.90% -1.88% |
93.90% -1.73% |
95.60% -1.73% |
| 2019-20 | 95.45% 0.56% |
94.84% 0.25% |
95.85% 0.25% |
| 2020-21 | 95.64% 0.19% |
95.29% 0.00% |
95.85% 0.00% |
| 2021-22 | 95.99% 0.36% |
94.99% 1.15% |
96.99% 1.15% |
| 2022-23 | 95.22% -0.77% |
94.24% -1.05% |
95.95% -1.05% |
| Average | 95.65% | 94.92% | 96.21% |