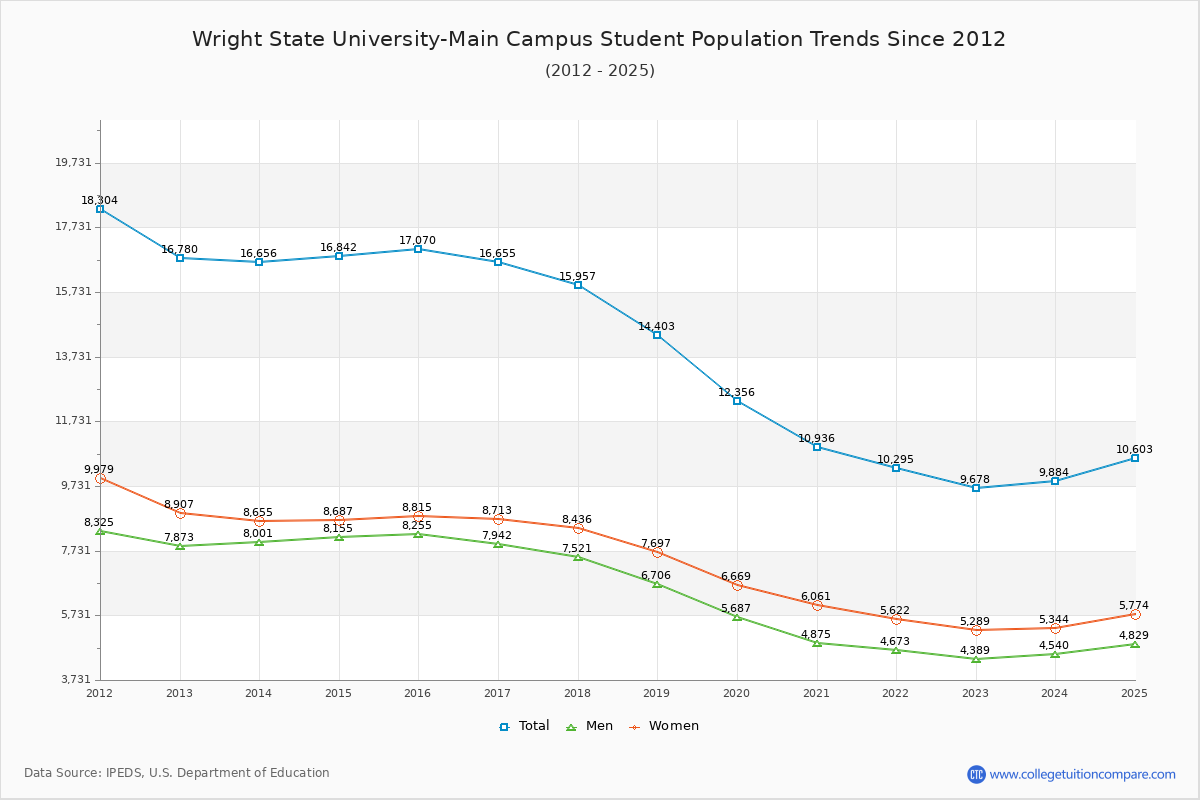
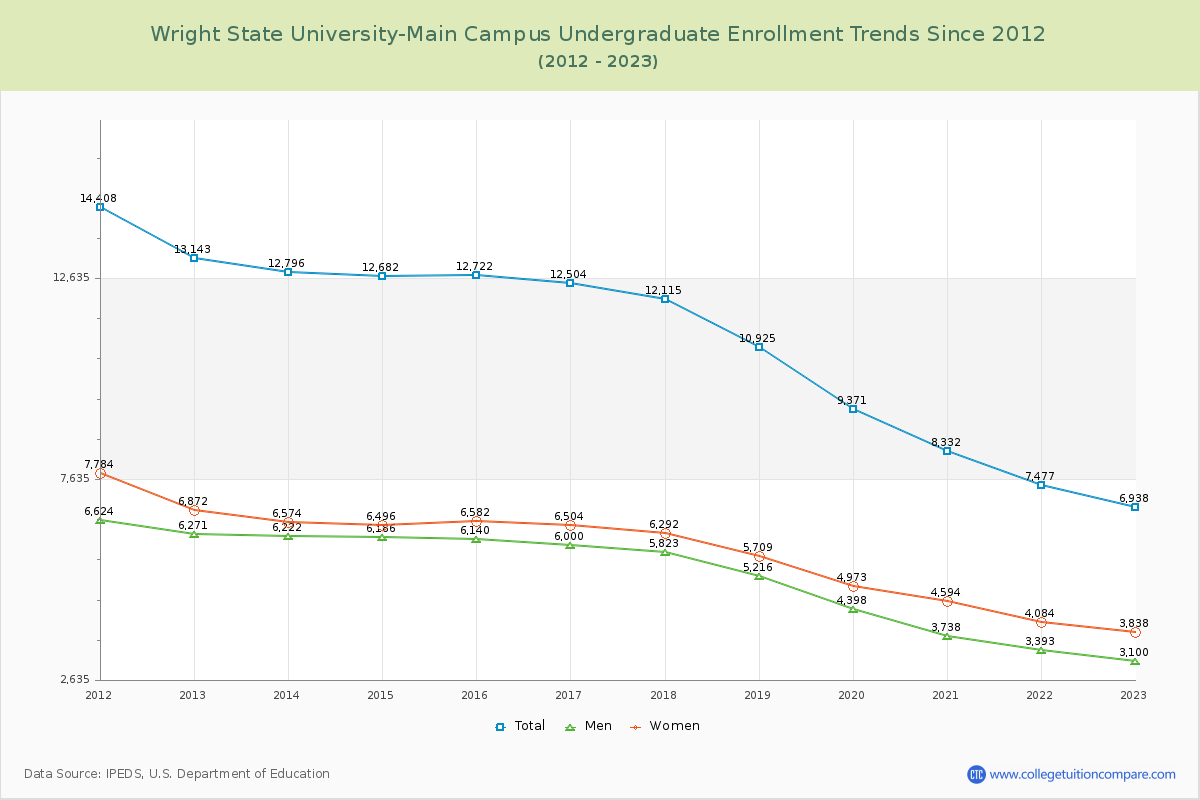
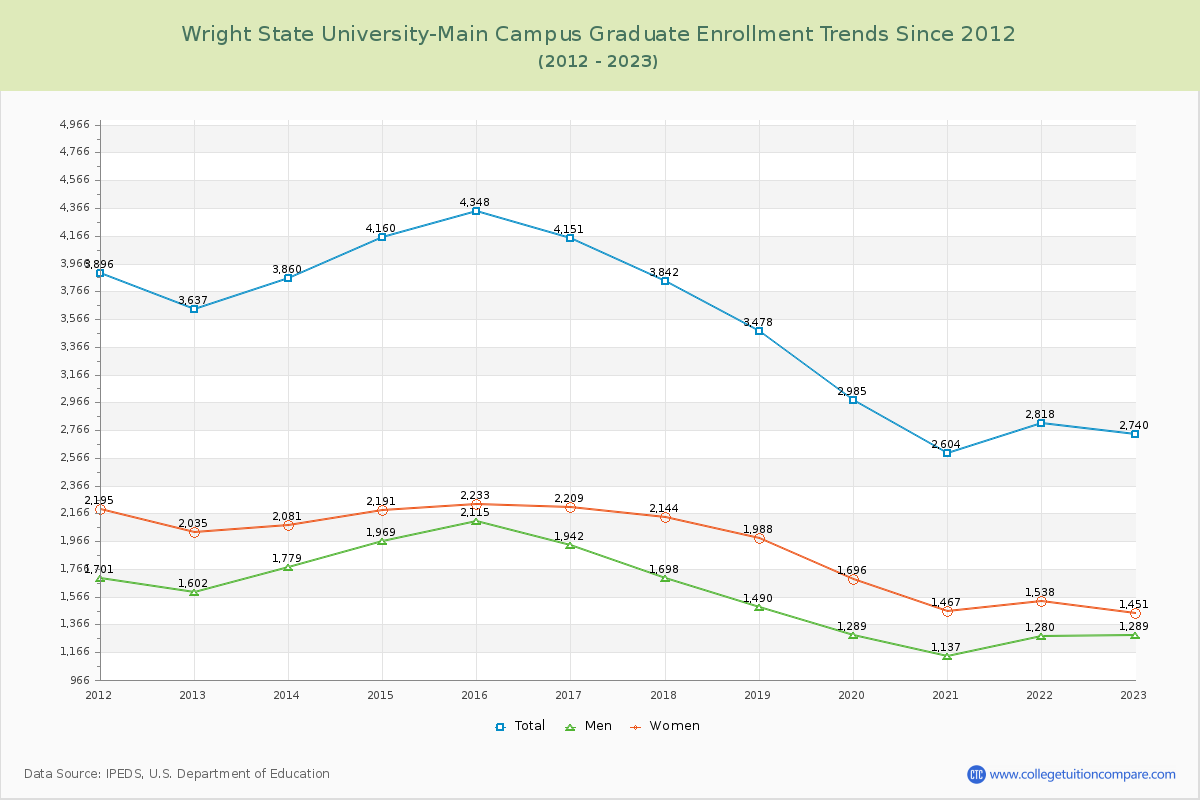
Student Population Changes
The average student population over the last 12 years is 14,330 where 9,678 students are attending the school for the academic year 2022-2023.
71.69% of total students is undergraduate students and 28.31% students is graduate students. The number of undergraduate students has decreased by 6,205 and the graduate enrollment has decreased by 897 over past 10 years.
The female to male ratio is 1.21 to 1 and it means that there are slightly more female students enrolled in Wright State University-Main Campus than male students.
The following table and chart illustrate the changes in student population by gender at Wright State University-Main Campus since 2012.
| Year | Total | Undergraduate | Graduate | ||||
|---|---|---|---|---|---|---|---|
| Total | Men | Women | Total | Men | Women | ||
| 2012-13 | 16,780 | 13,143 | 6,271 | 6,872 | 3,637 | 1,602 | 2,035 |
| 2013-14 | 16,656 -124 | 12,796 -347 | 6,222 -49 | 6,574 -298 | 3,860 223 | 1,779 177 | 2,081 46 |
| 2014-15 | 16,842 186 | 12,682 -114 | 6,186 -36 | 6,496 -78 | 4,160 300 | 1,969 190 | 2,191 110 |
| 2015-16 | 17,070 228 | 12,722 40 | 6,140 -46 | 6,582 86 | 4,348 188 | 2,115 146 | 2,233 42 |
| 2016-17 | 16,655 -415 | 12,504 -218 | 6,000 -140 | 6,504 -78 | 4,151 -197 | 1,942 -173 | 2,209 -24 |
| 2017-18 | 15,957 -698 | 12,115 -389 | 5,823 -177 | 6,292 -212 | 3,842 -309 | 1,698 -244 | 2,144 -65 |
| 2018-19 | 14,403 -1,554 | 10,925 -1,190 | 5,216 -607 | 5,709 -583 | 3,478 -364 | 1,490 -208 | 1,988 -156 |
| 2019-20 | 12,356 -2,047 | 9,371 -1,554 | 4,398 -818 | 4,973 -736 | 2,985 -493 | 1,289 -201 | 1,696 -292 |
| 2020-21 | 10,936 -1,420 | 8,332 -1,039 | 3,738 -660 | 4,594 -379 | 2,604 -381 | 1,137 -152 | 1,467 -229 |
| 2021-22 | 10,295 -641 | 7,477 -855 | 3,393 -345 | 4,084 -510 | 2,818 214 | 1,280 143 | 1,538 71 |
| 2022-23 | 9,678 -617 | 6,938 -539 | 3,100 -293 | 3,838 -246 | 2,740 -78 | 1,289 9 | 1,451 -87 |
| Average | 14,330 | 10,819 | 5,135 | 5,683 | 3,511 | 1,599 | 1,912 |