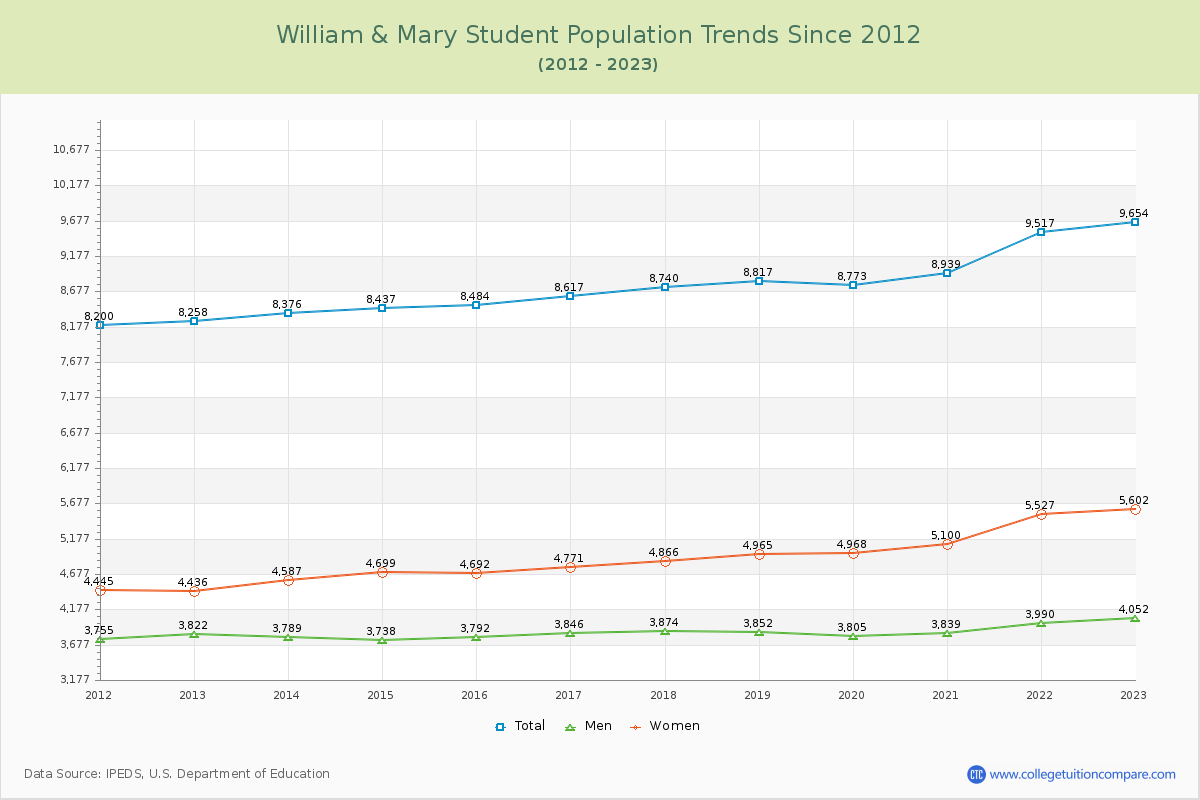
Student Population Changes
The average student population over the last 12 years is 8,783 where 9,654 students are attending the school for the academic year 2022-2023.
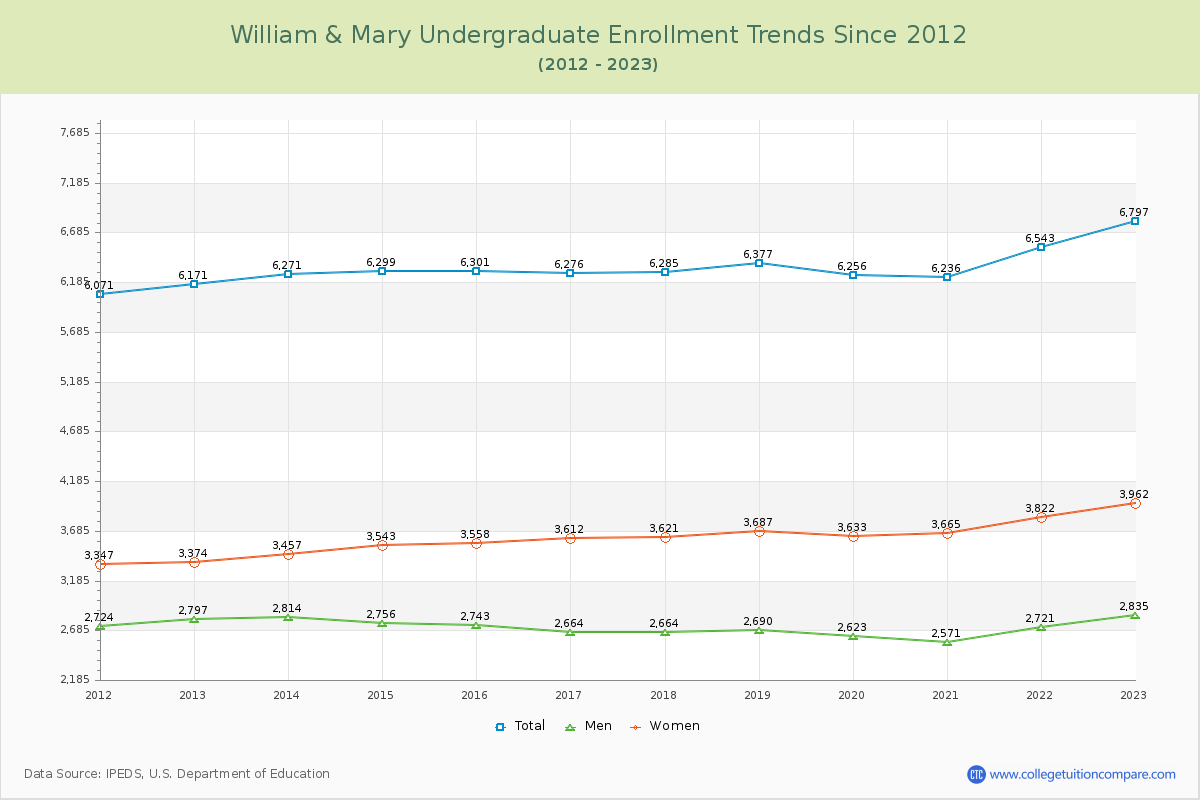
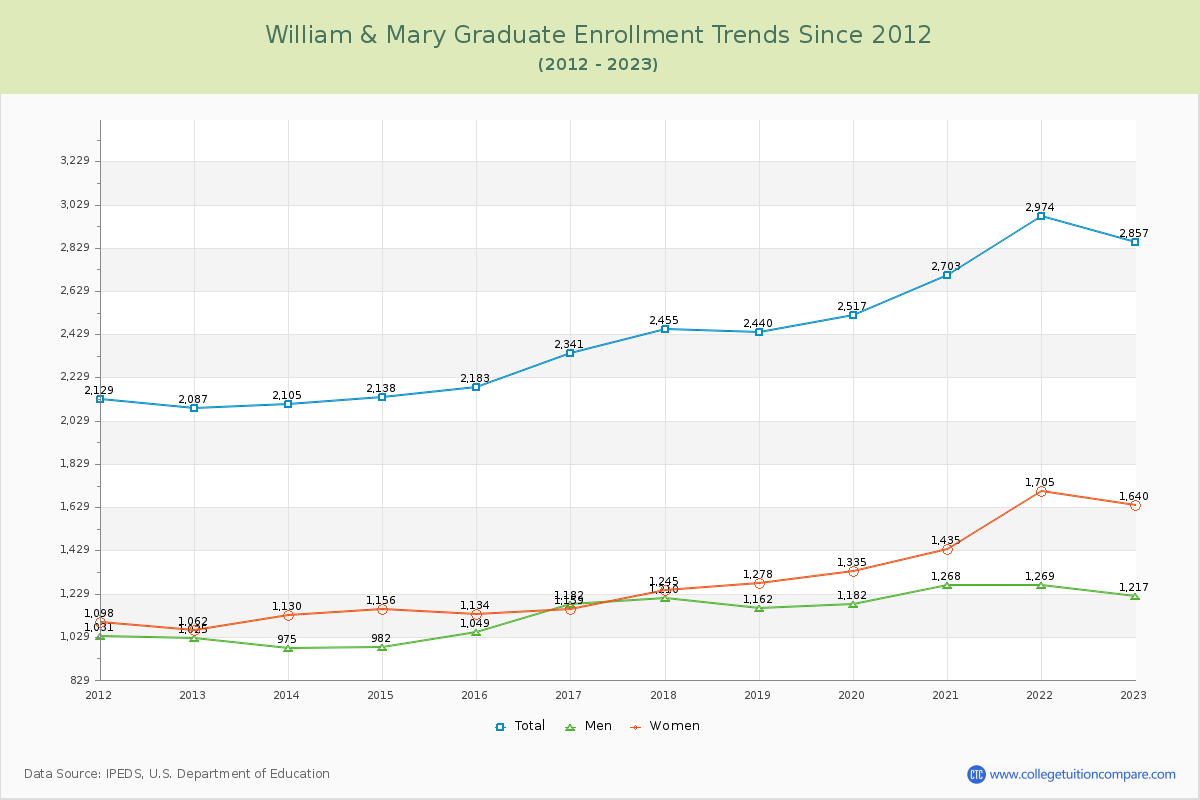
70.41% of total students is undergraduate students and 29.59% students is graduate students. The number of undergraduate students has increased by 626 and the graduate enrollment has increased by 770 over past 10 years.
The female to male ratio is 1.38 to 1 and it means that there are more female students enrolled in W & M than male students.
The following table and chart illustrate the changes in student population by gender at William & Mary since 2012.
| Year | Total | Undergraduate | Graduate | ||||
|---|---|---|---|---|---|---|---|
| Total | Men | Women | Total | Men | Women | ||
| 2012-13 | 8,258 | 6,171 | 2,797 | 3,374 | 2,087 | 1,025 | 1,062 |
| 2013-14 | 8,376 118 | 6,271 100 | 2,814 17 | 3,457 83 | 2,105 18 | 975 -50 | 1,130 68 |
| 2014-15 | 8,437 61 | 6,299 28 | 2,756 -58 | 3,543 86 | 2,138 33 | 982 7 | 1,156 26 |
| 2015-16 | 8,484 47 | 6,301 2 | 2,743 -13 | 3,558 15 | 2,183 45 | 1,049 67 | 1,134 -22 |
| 2016-17 | 8,617 133 | 6,276 -25 | 2,664 -79 | 3,612 54 | 2,341 158 | 1,182 133 | 1,159 25 |
| 2017-18 | 8,740 123 | 6,285 9 | 2,664 0 | 3,621 9 | 2,455 114 | 1,210 28 | 1,245 86 |
| 2018-19 | 8,817 77 | 6,377 92 | 2,690 26 | 3,687 66 | 2,440 -15 | 1,162 -48 | 1,278 33 |
| 2019-20 | 8,773 -44 | 6,256 -121 | 2,623 -67 | 3,633 -54 | 2,517 77 | 1,182 20 | 1,335 57 |
| 2020-21 | 8,939 166 | 6,236 -20 | 2,571 -52 | 3,665 32 | 2,703 186 | 1,268 86 | 1,435 100 |
| 2021-22 | 9,517 578 | 6,543 307 | 2,721 150 | 3,822 157 | 2,974 271 | 1,269 1 | 1,705 270 |
| 2022-23 | 9,654 137 | 6,797 254 | 2,835 114 | 3,962 140 | 2,857 -117 | 1,217 -52 | 1,640 -65 |
| Average | 8,783 | 6,347 | 2,716 | 3,630 | 2,436 | 1,138 | 1,298 |