SAT Scores Over Time
The 2023 SAT score is 1460 at W & M. Over the past 12 years, the average SAT score is 1297 (25th percentile) and 1485 (75th percentile). Compared to similar schools, the submitted SAT scores are competitive and high at W & M.
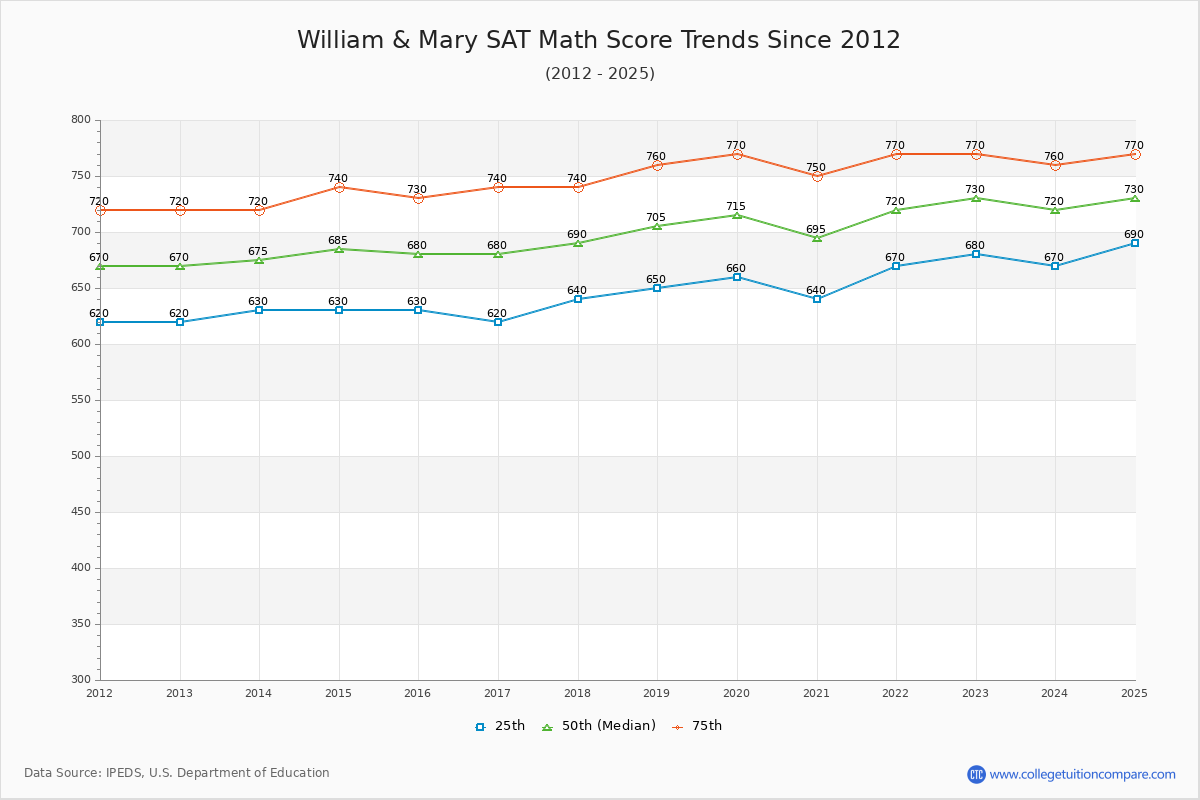
The following table and chart illustrate the changes in SAT scores at William & Mary since 2012.
| Year | Total | Math | Evidence-Based Reading and Writing | ||||||
|---|---|---|---|---|---|---|---|---|---|
| 25th | 50th | 75th | 25th | 50th | 75th | 25th | 50th | 75th | |
| 2012-13 | 1,250 | 1,355 | 1,460 | 620 | 670 | 720 | 630 | 685 | 740 |
| 2013-14 | 1,270 | 1,365 | 1,460 | 630 | 675 | 720 | 640 | 690 | 740 |
| 2014-15 | 1,270 | 1,370 | 1,470 | 630 | 685 | 740 | 640 | 685 | 730 |
| 2015-16 | 1,260 | 1,360 | 1,460 | 630 | 680 | 730 | 630 | 680 | 730 |
| 2016-17 | 1,250 | 1,360 | 1,470 | 620 | 680 | 740 | 630 | 680 | 730 |
| 2017-18 | 1,300 | 1,390 | 1,480 | 640 | 690 | 740 | 660 | 700 | 740 |
| 2018-19 | 1,310 | 1,400 | 1,490 | 650 | 705 | 760 | 660 | 695 | 730 |
| 2019-20 | 1,320 | 1,415 | 1,510 | 660 | 715 | 770 | 660 | 700 | 740 |
| 2020-21 | 1,300 | 1,395 | 1,490 | 640 | 695 | 750 | 660 | 700 | 740 |
| 2021-22 | 1,360 | 1,440 | 1,520 | 670 | 720 | 770 | 690 | 720 | 750 |
| 2022-23 | 1,375 | 1,460 | 1,520 | 680 | 730 | 770 | 695 | 730 | 750 |
| Average | 1297 | 1392 | 1485 | 643 | 695 | 746 | 654 | 697 | 738 |
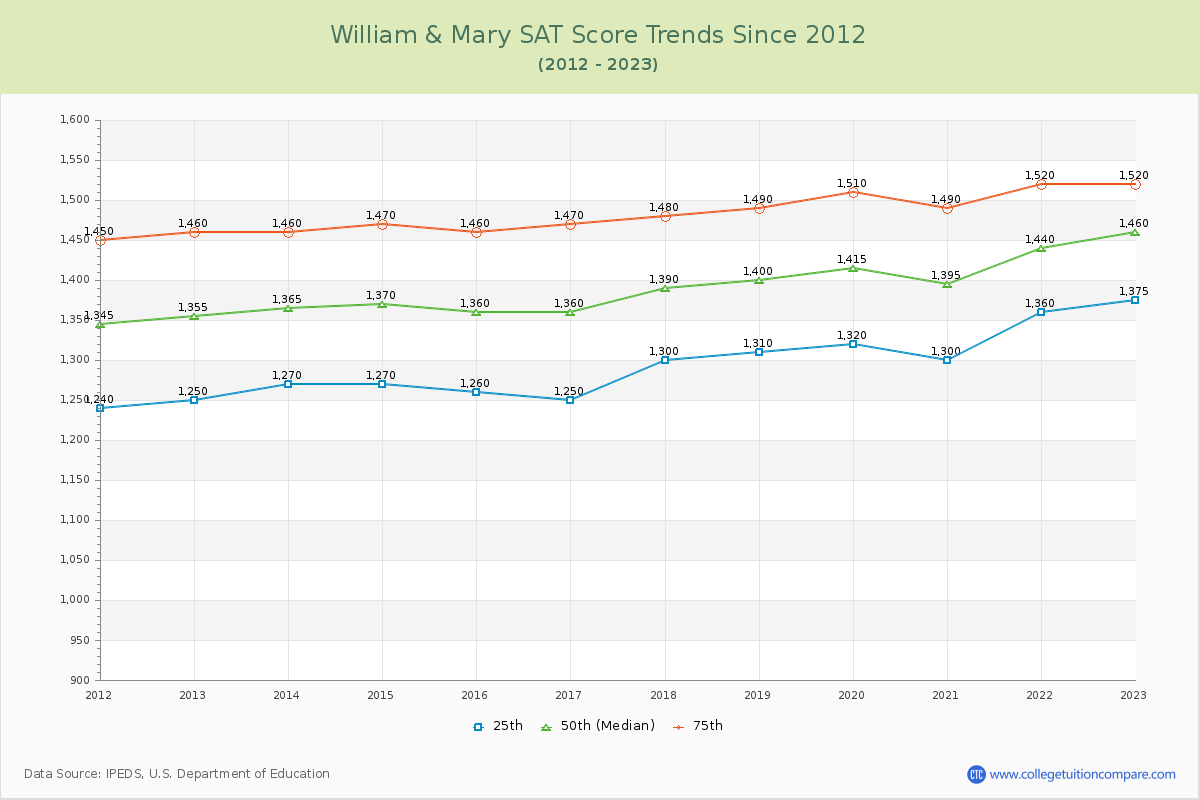
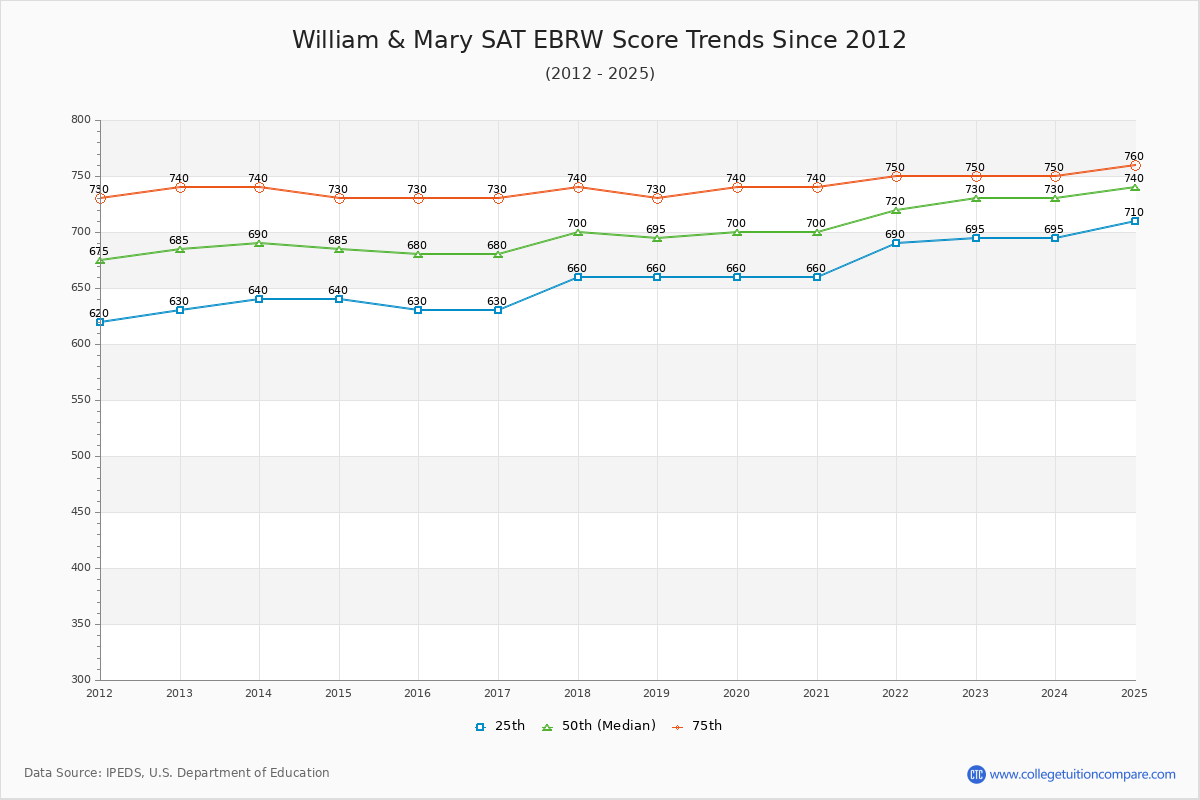
*SAT Evidence-Based Reading and Writing replaces SAT critical reading and writing since year 2017.
**The SAT Writing score is excluded from the total scores for year from 2011 to 2016.