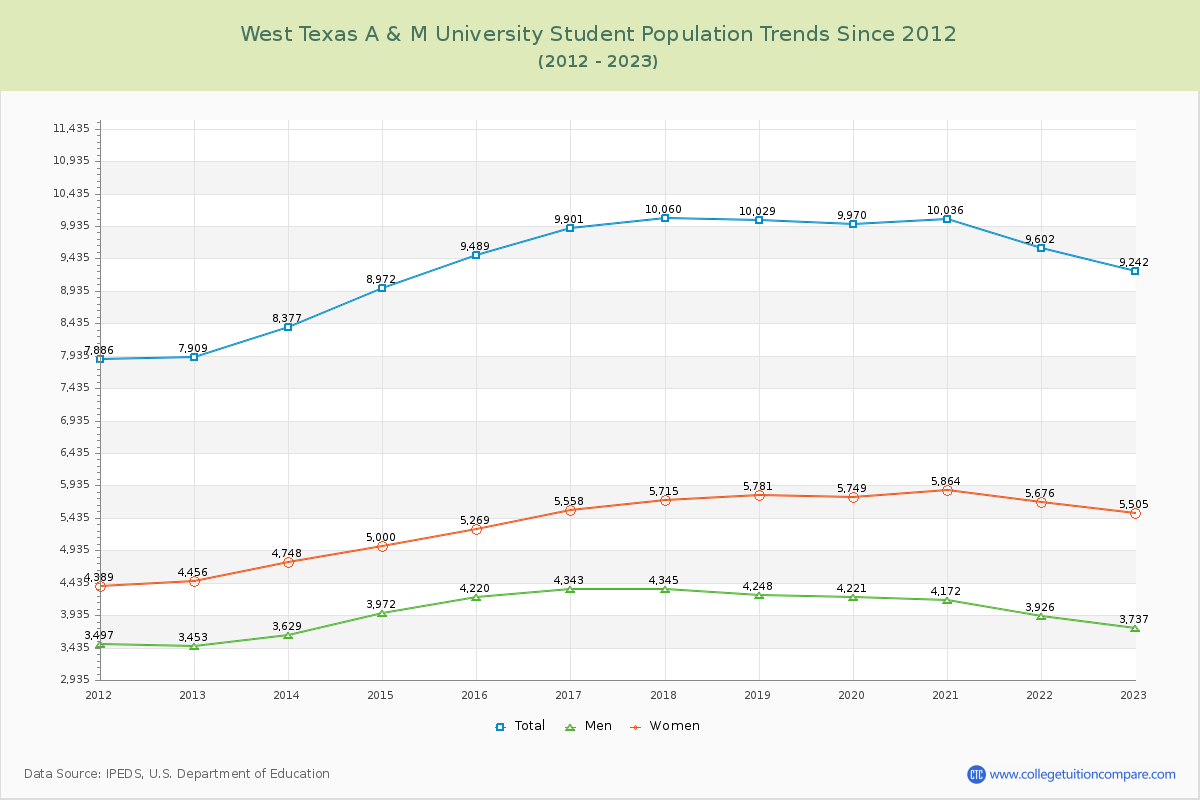
Student Population Changes
The average student population over the last 12 years is 9,417 where 9,242 students are attending the school for the academic year 2022-2023.
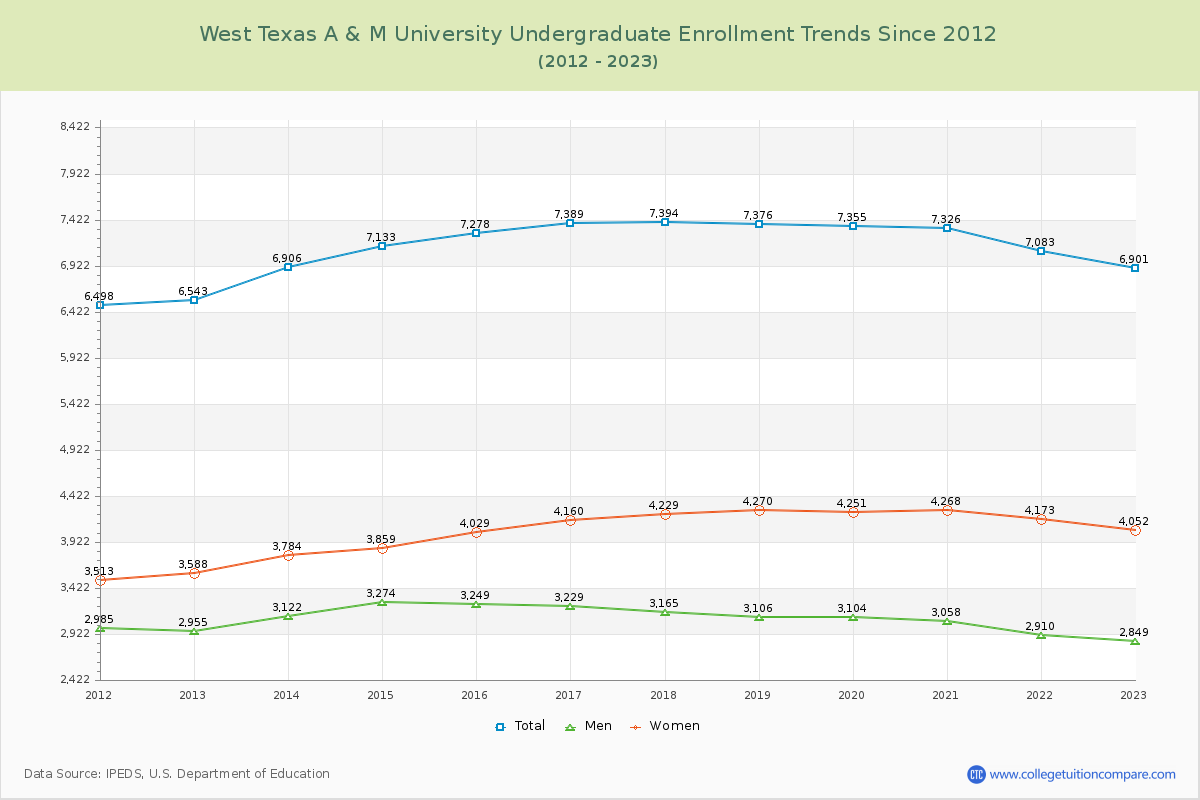
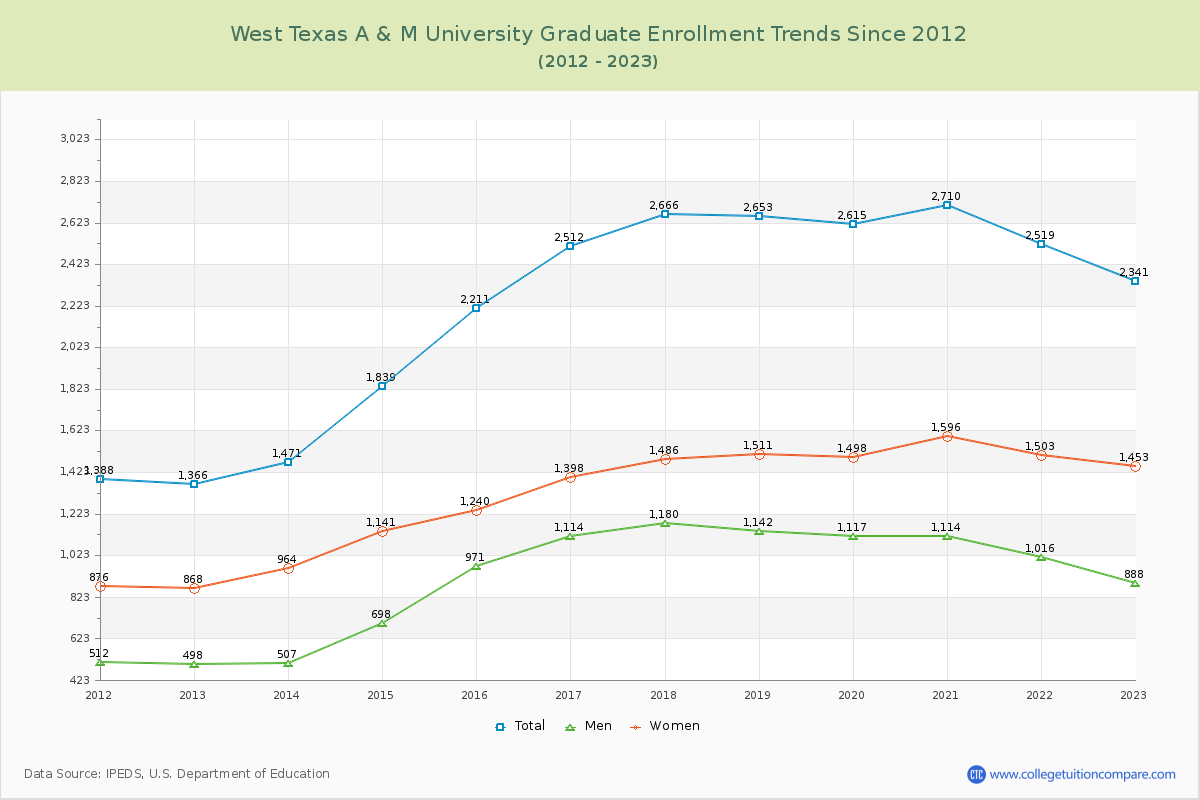
74.67% of total students is undergraduate students and 25.33% students is graduate students. The number of undergraduate students has increased by 358 and the graduate enrollment has increased by 975 over past 10 years.
The female to male ratio is 1.47 to 1 and it means that there are more female students enrolled in WTAMU than male students.
The following table and chart illustrate the changes in student population by gender at West Texas A & M University since 2012.
| Year | Total | Undergraduate | Graduate | ||||
|---|---|---|---|---|---|---|---|
| Total | Men | Women | Total | Men | Women | ||
| 2012-13 | 7,909 | 6,543 | 2,955 | 3,588 | 1,366 | 498 | 868 |
| 2013-14 | 8,377 468 | 6,906 363 | 3,122 167 | 3,784 196 | 1,471 105 | 507 9 | 964 96 |
| 2014-15 | 8,972 595 | 7,133 227 | 3,274 152 | 3,859 75 | 1,839 368 | 698 191 | 1,141 177 |
| 2015-16 | 9,489 517 | 7,278 145 | 3,249 -25 | 4,029 170 | 2,211 372 | 971 273 | 1,240 99 |
| 2016-17 | 9,901 412 | 7,389 111 | 3,229 -20 | 4,160 131 | 2,512 301 | 1,114 143 | 1,398 158 |
| 2017-18 | 10,060 159 | 7,394 5 | 3,165 -64 | 4,229 69 | 2,666 154 | 1,180 66 | 1,486 88 |
| 2018-19 | 10,029 -31 | 7,376 -18 | 3,106 -59 | 4,270 41 | 2,653 -13 | 1,142 -38 | 1,511 25 |
| 2019-20 | 9,970 -59 | 7,355 -21 | 3,104 -2 | 4,251 -19 | 2,615 -38 | 1,117 -25 | 1,498 -13 |
| 2020-21 | 10,036 66 | 7,326 -29 | 3,058 -46 | 4,268 17 | 2,710 95 | 1,114 -3 | 1,596 98 |
| 2021-22 | 9,602 -434 | 7,083 -243 | 2,910 -148 | 4,173 -95 | 2,519 -191 | 1,016 -98 | 1,503 -93 |
| 2022-23 | 9,242 -360 | 6,901 -182 | 2,849 -61 | 4,052 -121 | 2,341 -178 | 888 -128 | 1,453 -50 |
| Average | 9,417 | 7,153 | 3,093 | 4,060 | 2,264 | 931 | 1,333 |