Student Population by Gender
West Texas A & M University has a total of 9,242 enrolled students for the academic year 2022-2023. 6,901 students have enrolled in undergraduate programs and 2,341 students joined graduate programs.
By gender, 3,737 male and 5,505 female students (the male-female ratio is 40:60) are attending the school. The gender distribution is based on the 2022-2023 data.
| Total | Undergraduate | Graduate | |
|---|---|---|---|
| Total | 9,242 | 6,901 | 2,341 |
| Men | 3,737 | 2,849 | 888 |
| Women | 5,505 | 4,052 | 1,453 |
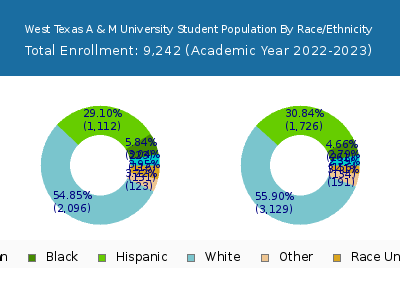
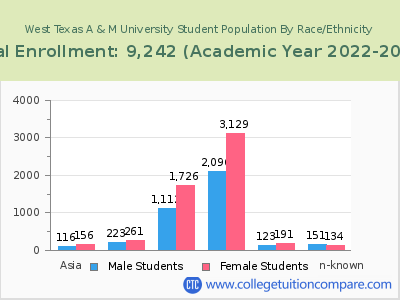
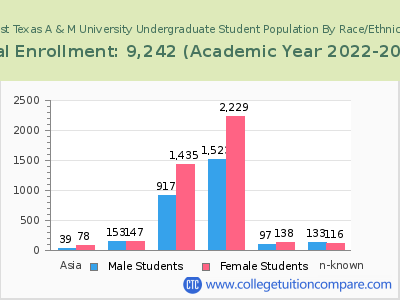
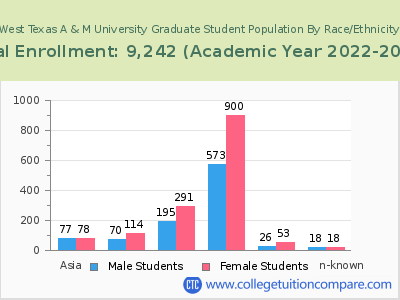
Student Distribution by Race/Ethnicity
| Race | Total | Men | Women |
|---|---|---|---|
| American Indian or Native American | 45 | 17 | 28 |
| Asian | 258 | 105 | 153 |
| Black | 466 | 222 | 244 |
| Hispanic | 2,765 | 1,080 | 1,685 |
| Native Hawaiian or Other Pacific Islanders | 13 | 8 | 5 |
| White | 4,973 | 1,961 | 3,012 |
| Two or more races | 230 | 93 | 137 |
| Race Unknown | 295 | 144 | 151 |
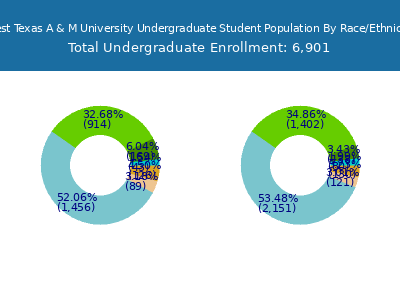
| Race | Total | Men | Women |
|---|---|---|---|
| American Indian or Native American | 36 | 13 | 23 |
| Asian | 123 | 43 | 80 |
| Black | 307 | 169 | 138 |
| Hispanic | 2,316 | 914 | 1,402 |
| Native Hawaiian or Other Pacific Islanders | 10 | 7 | 3 |
| White | 3,607 | 1,456 | 2,151 |
| Two or more races | 164 | 69 | 95 |
| Race Unknown | 256 | 126 | 130 |
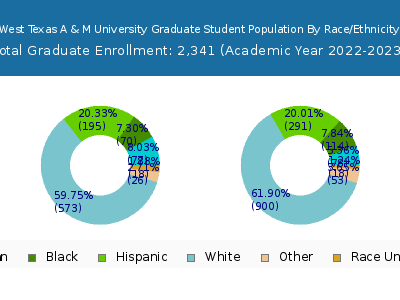
| Race | Total | Men | Women |
|---|---|---|---|
| American Indian or Native American | 6 | 2 | 4 |
| Asian | 17 | 8 | 9 |
| Black | 47 | 21 | 26 |
| Hispanic | 306 | 108 | 198 |
| Native Hawaiian or Other Pacific Islanders | 0 | 0 | 0 |
| White | 444 | 169 | 275 |
| Two or more races | 13 | 7 | 6 |
| Race Unknown | 29 | 10 | 19 |
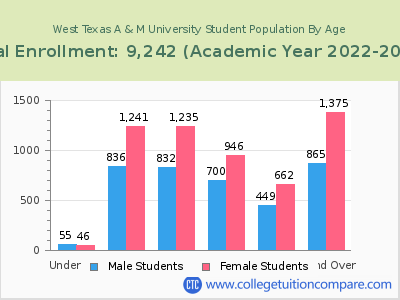
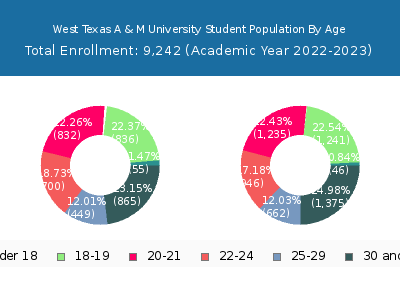
Student Age Distribution
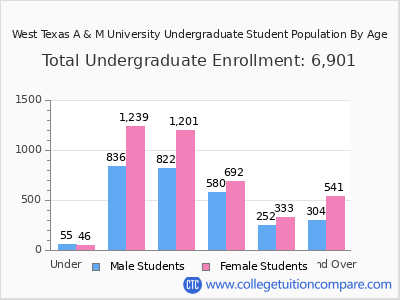
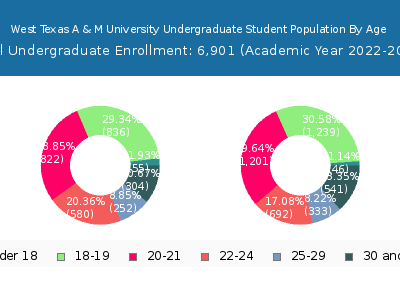
By age, WTAMU has 101 students under 18 years old and 12 students over 65 years old. There are 5,891 students under 25 years old, and 3,351 students over 25 years old out of 9,242 total students.
In undergraduate programs, 101 students are younger than 18 and 7 students are older than 65. WTAMU has 5,471 undergraduate students aged under 25 and 1,430 students aged 25 and over.
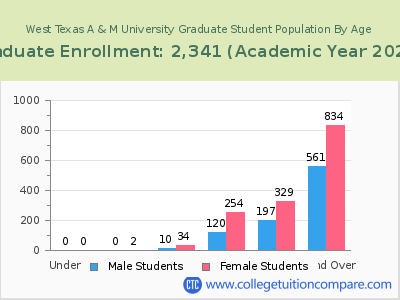
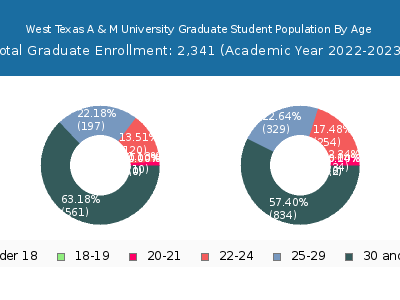
It has 420 graduate students aged under 25 and 1,921 students aged 25 and over.
| Age | Total | Men | Women |
|---|---|---|---|
| Under 18 | 101 | 46 | 55 |
| 18-19 | 2,077 | 1,241 | 836 |
| 20-21 | 2,067 | 1,235 | 832 |
| 22-24 | 1,646 | 946 | 700 |
| 25-29 | 1,111 | 662 | 449 |
| 30-34 | 740 | 474 | 266 |
| 35-39 | 563 | 329 | 234 |
| 40-49 | 672 | 418 | 254 |
| 50-64 | 253 | 149 | 104 |
| Over 65 | 12 | 5 | 7 |
| Age | Total | Men | Women |
|---|---|---|---|
| Under 18 | 101 | 46 | 55 |
| 18-19 | 2,075 | 1,239 | 836 |
| 20-21 | 2,023 | 1,201 | 822 |
| 22-24 | 1,272 | 692 | 580 |
| 25-29 | 585 | 333 | 252 |
| 30-34 | 316 | 220 | 96 |
| 35-39 | 202 | 127 | 75 |
| 40-49 | 238 | 141 | 97 |
| 50-64 | 82 | 50 | 32 |
| Over 65 | 7 | 3 | 4 |
| Age | Total | Men | Women |
|---|
Online Student Enrollment
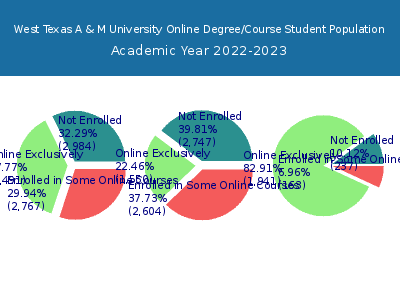
Distance learning, also called online education, is very attractive to students, especially who want to continue education and work in field. At West Texas A & M University, 3,491 students are enrolled exclusively in online courses and 2,767 students are enrolled in some online courses.
2,695 students lived in Texas or jurisdiction in which the school is located are enrolled exclusively in online courses and 796 students live in other State or outside of the United States.
| All Students | Enrolled Exclusively Online Courses | Enrolled in Some Online Courses | |
|---|---|---|---|
| All Students | 9,242 | 3,491 | 2,767 |
| Undergraduate | 6,901 | 1,550 | 2,604 |
| Graduate | 2,341 | 1,941 | 163 |
| Texas Residents | Other States in U.S. | Outside of U.S. | |
|---|---|---|---|
| All Students | 2,695 | 733 | 63 |
| Undergraduate | 1,415 | 133 | 2 |
| Graduate | 1,280 | 600 | 61 |
Transfer-in Students (Undergraduate)
Among 6,901 enrolled in undergraduate programs, 877 students have transferred-in from other institutions. The percentage of transfer-in students is 12.71%.653 students have transferred in as full-time status and 224 students transferred in as part-time status.
| Number of Students | |
|---|---|
| Regular Full-time | 4,663 |
| Transfer-in Full-time | 653 |
| Regular Part-time | 1,361 |
| Transfer-in Part-time | 224 |
