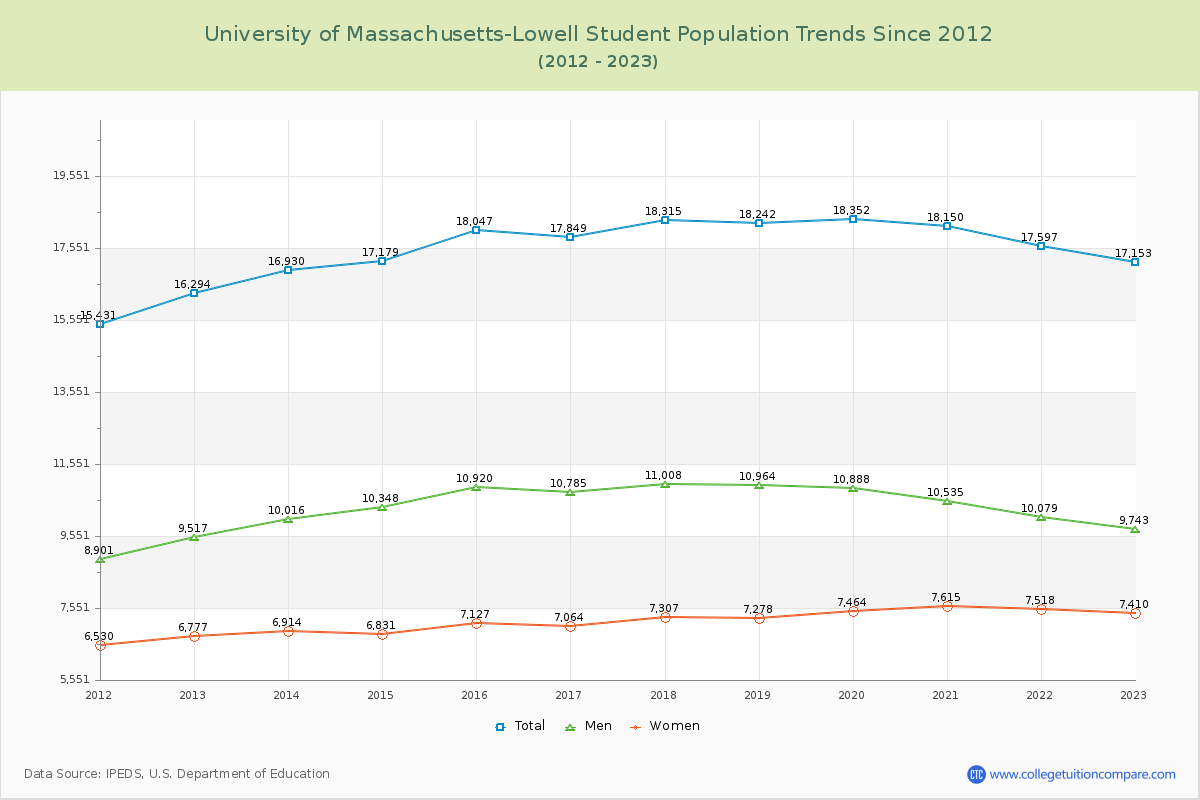
Student Population Changes
The average student population over the last 12 years is 17,646 where 17,153 students are attending the school for the academic year 2022-2023.
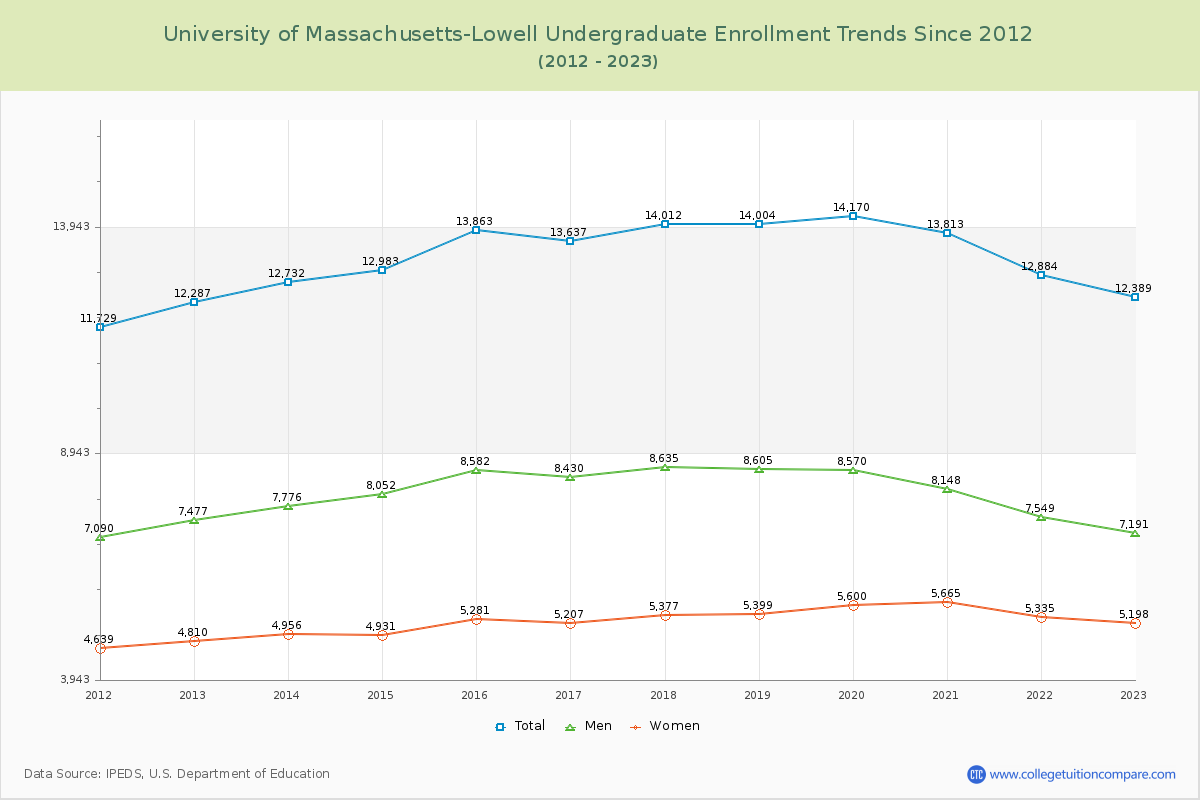
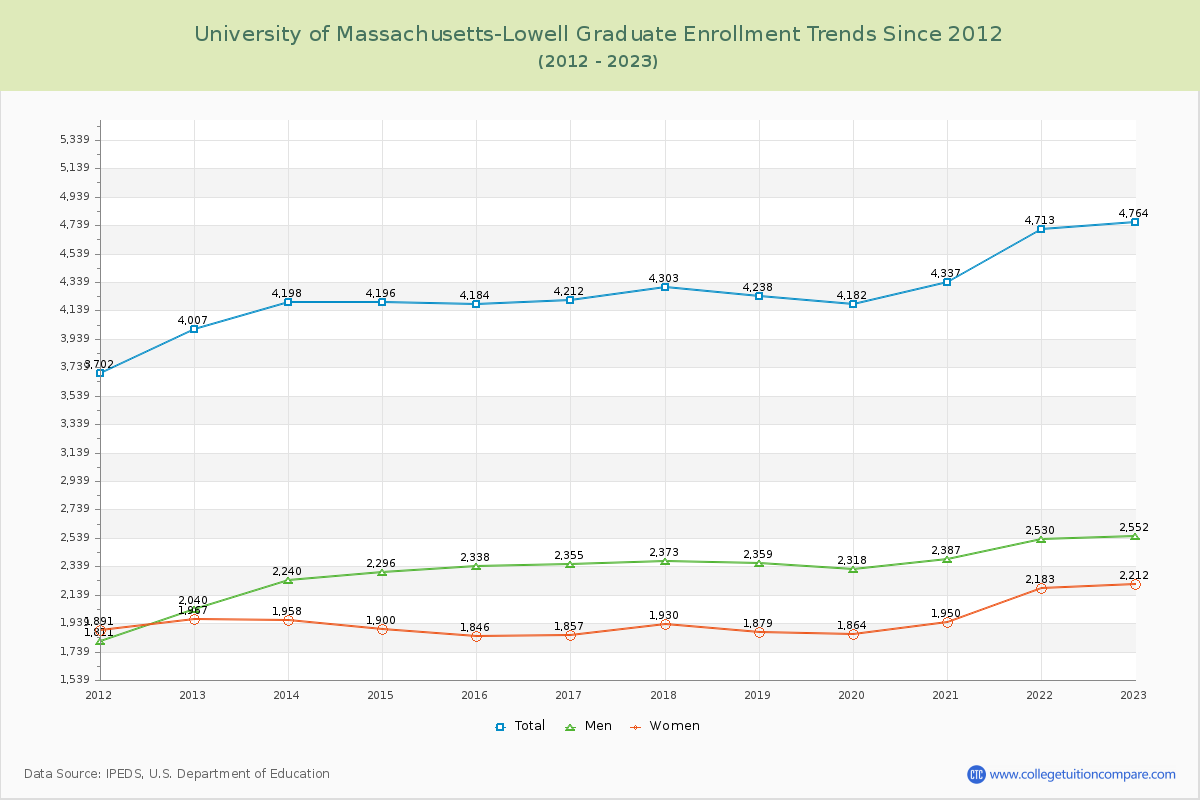
72.23% of total students is undergraduate students and 27.77% students is graduate students. The number of undergraduate students has increased by 102 and the graduate enrollment has increased by 757 over past 10 years.
The female to male ratio is 0.76 to 1 and it means that there are more male students enrolled in U of Massachusetts-Lowell than female students.
The following table and chart illustrate the changes in student population by gender at University of Massachusetts-Lowell since 2012.
| Year | Total | Undergraduate | Graduate | ||||
|---|---|---|---|---|---|---|---|
| Total | Men | Women | Total | Men | Women | ||
| 2012-13 | 16,294 | 12,287 | 7,477 | 4,810 | 4,007 | 2,040 | 1,967 |
| 2013-14 | 16,930 636 | 12,732 445 | 7,776 299 | 4,956 146 | 4,198 191 | 2,240 200 | 1,958 -9 |
| 2014-15 | 17,179 249 | 12,983 251 | 8,052 276 | 4,931 -25 | 4,196 -2 | 2,296 56 | 1,900 -58 |
| 2015-16 | 18,047 868 | 13,863 880 | 8,582 530 | 5,281 350 | 4,184 -12 | 2,338 42 | 1,846 -54 |
| 2016-17 | 17,849 -198 | 13,637 -226 | 8,430 -152 | 5,207 -74 | 4,212 28 | 2,355 17 | 1,857 11 |
| 2017-18 | 18,315 466 | 14,012 375 | 8,635 205 | 5,377 170 | 4,303 91 | 2,373 18 | 1,930 73 |
| 2018-19 | 18,242 -73 | 14,004 -8 | 8,605 -30 | 5,399 22 | 4,238 -65 | 2,359 -14 | 1,879 -51 |
| 2019-20 | 18,352 110 | 14,170 166 | 8,570 -35 | 5,600 201 | 4,182 -56 | 2,318 -41 | 1,864 -15 |
| 2020-21 | 18,150 -202 | 13,813 -357 | 8,148 -422 | 5,665 65 | 4,337 155 | 2,387 69 | 1,950 86 |
| 2021-22 | 17,597 -553 | 12,884 -929 | 7,549 -599 | 5,335 -330 | 4,713 376 | 2,530 143 | 2,183 233 |
| 2022-23 | 17,153 -444 | 12,389 -495 | 7,191 -358 | 5,198 -137 | 4,764 51 | 2,552 22 | 2,212 29 |
| Average | 17,646 | 13,343 | 8,092 | 5,251 | 4,303 | 2,344 | 1,959 |