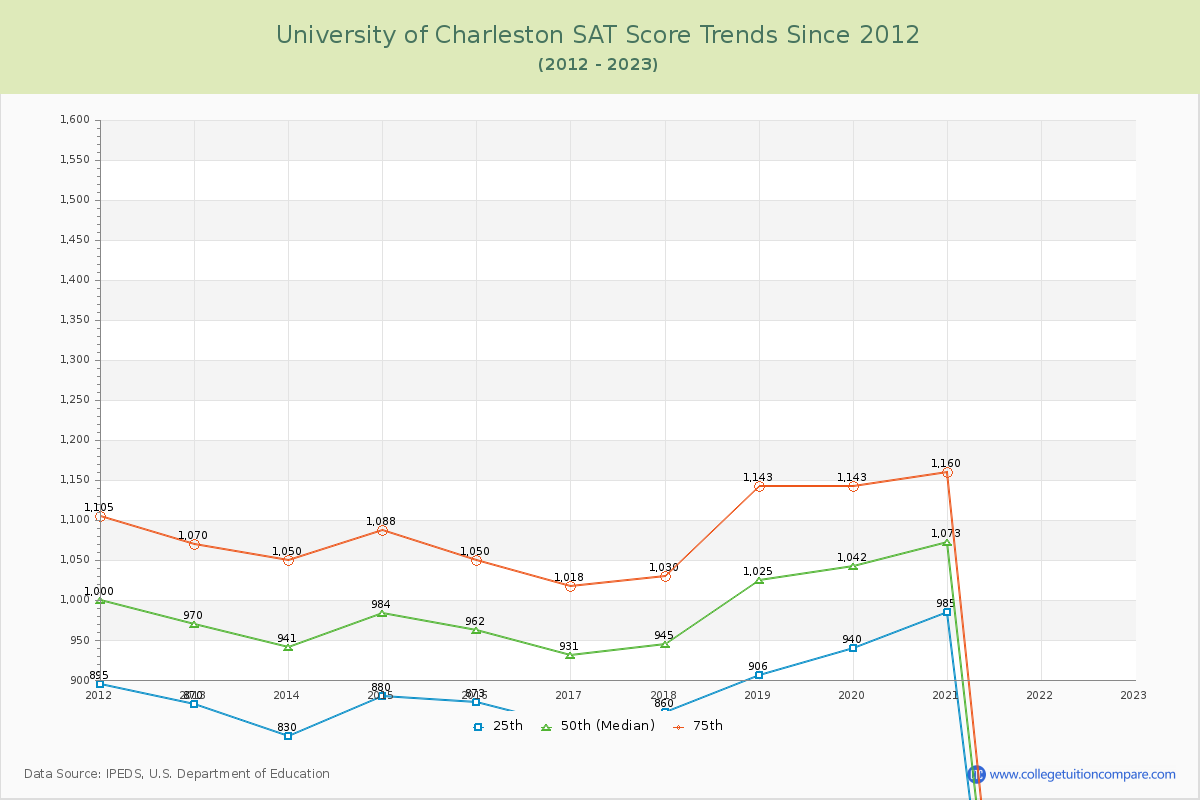
SAT Scores Over Time
The 2023 SAT score is at U of Charleston. Over the past 12 years, the average SAT score is 887 (25th percentile) and 1084 (75th percentile). Compared to similar schools, the submitted SAT scores are around national average at U of Charleston.
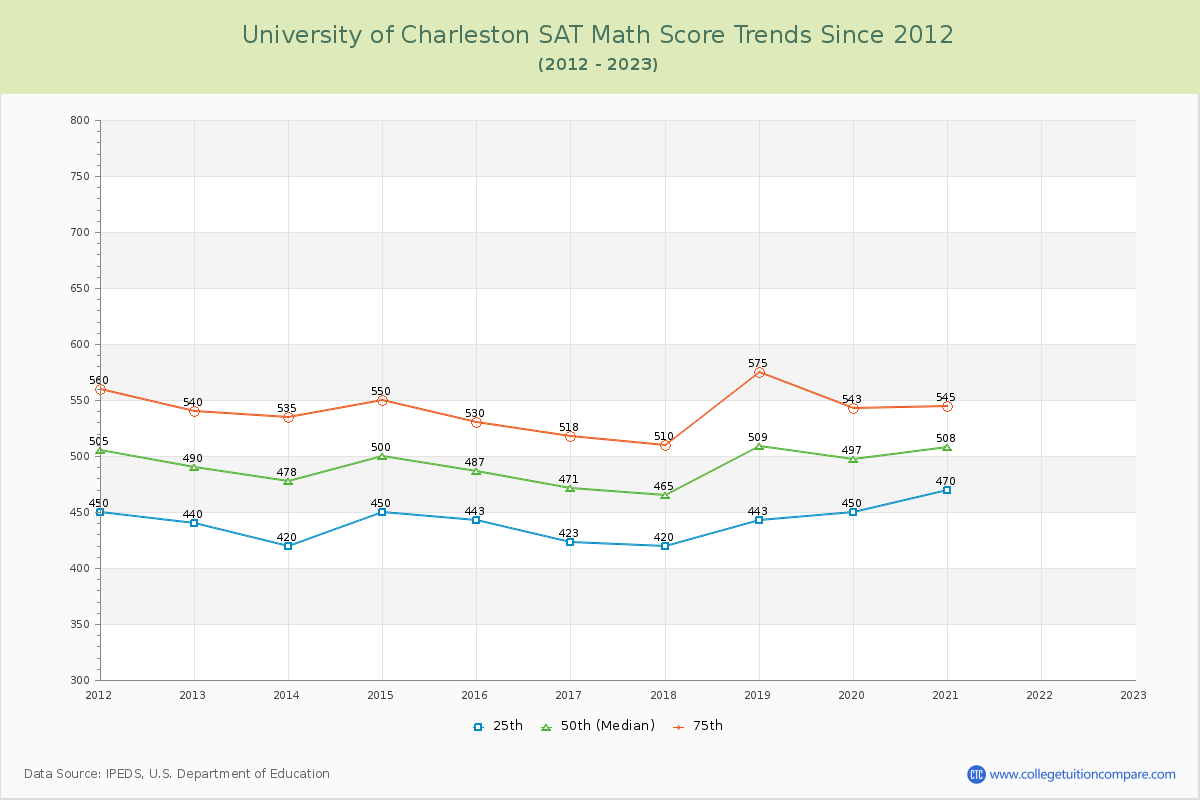
The following table and chart illustrate the changes in SAT scores at University of Charleston since 2012.
| Year | Total | Math | Evidence-Based Reading and Writing | ||||||
|---|---|---|---|---|---|---|---|---|---|
| 25th | 50th | 75th | 25th | 50th | 75th | 25th | 50th | 75th | |
| 2012-13 | 870 | 970 | 1,070 | 440 | 490 | 540 | 430 | 480 | 530 |
| 2013-14 | 830 | 940 | 1,050 | 420 | 478 | 535 | 410 | 463 | 515 |
| 2014-15 | 880 | 984 | 1,088 | 450 | 500 | 550 | 430 | 484 | 538 |
| 2015-16 | 873 | 962 | 1,050 | 443 | 487 | 530 | 430 | 475 | 520 |
| 2016-17 | 843 | 931 | 1,018 | 423 | 471 | 518 | 420 | 460 | 500 |
| 2017-18 | 860 | 945 | 1,030 | 420 | 465 | 510 | 440 | 480 | 520 |
| 2018-19 | 906 | 1,025 | 1,143 | 443 | 509 | 575 | 463 | 516 | 568 |
| 2019-20 | 940 | 1,042 | 1,143 | 450 | 497 | 543 | 490 | 545 | 600 |
| 2020-21 | 985 | 1,073 | 1,160 | 470 | 508 | 545 | 515 | 565 | 615 |
| 2021-22 | - | - | - | - | - | - | - | - | - |
| 2022-23 | - | - | - | - | - | - | - | - | - |
| Average | 887 | 986 | 1084 | 440 | 489 | 538 | 448 | 496 | 545 |
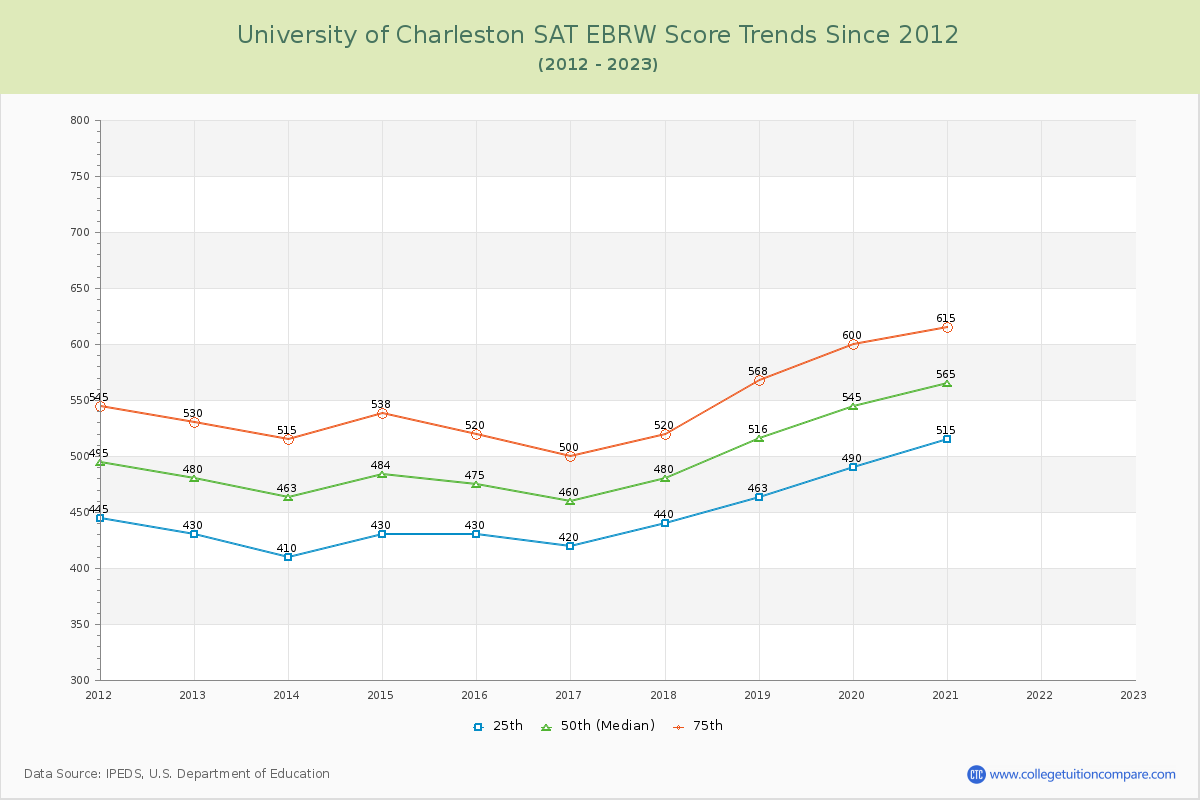
*SAT Evidence-Based Reading and Writing replaces SAT critical reading and writing since year 2017.
**The SAT Writing score is excluded from the total scores for year from 2011 to 2016.