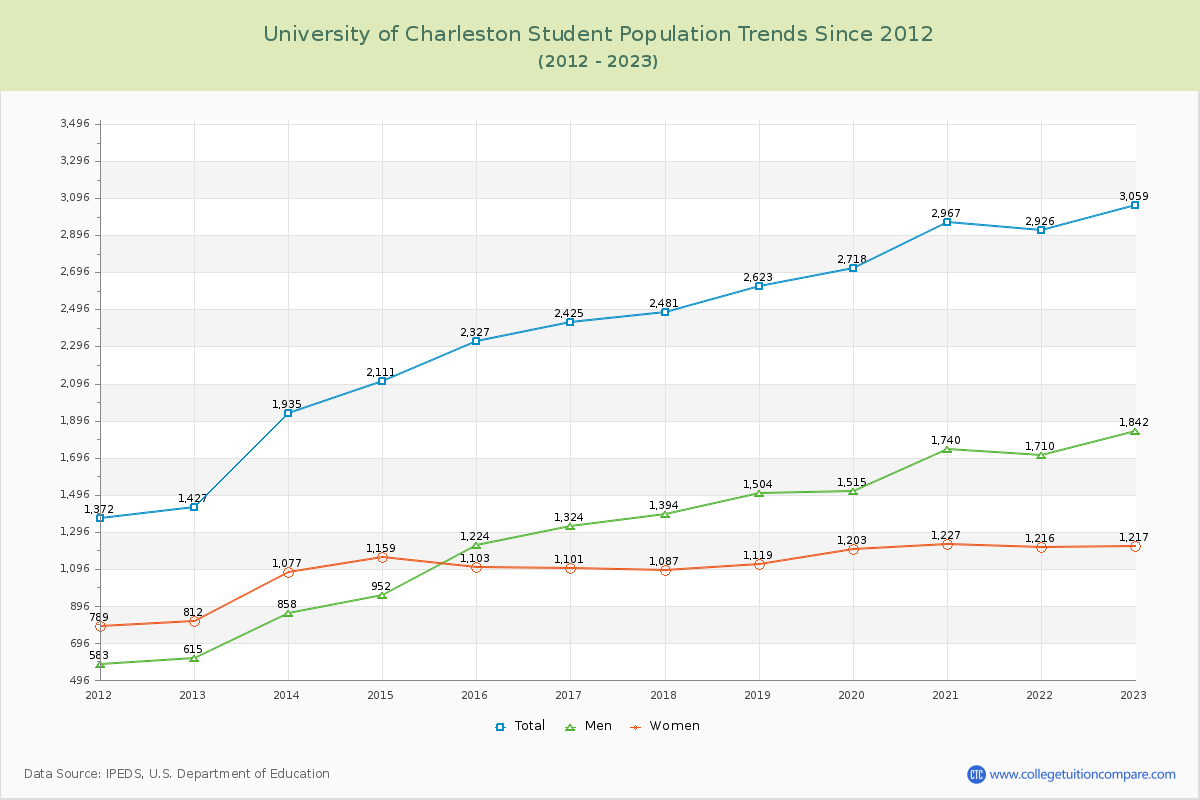
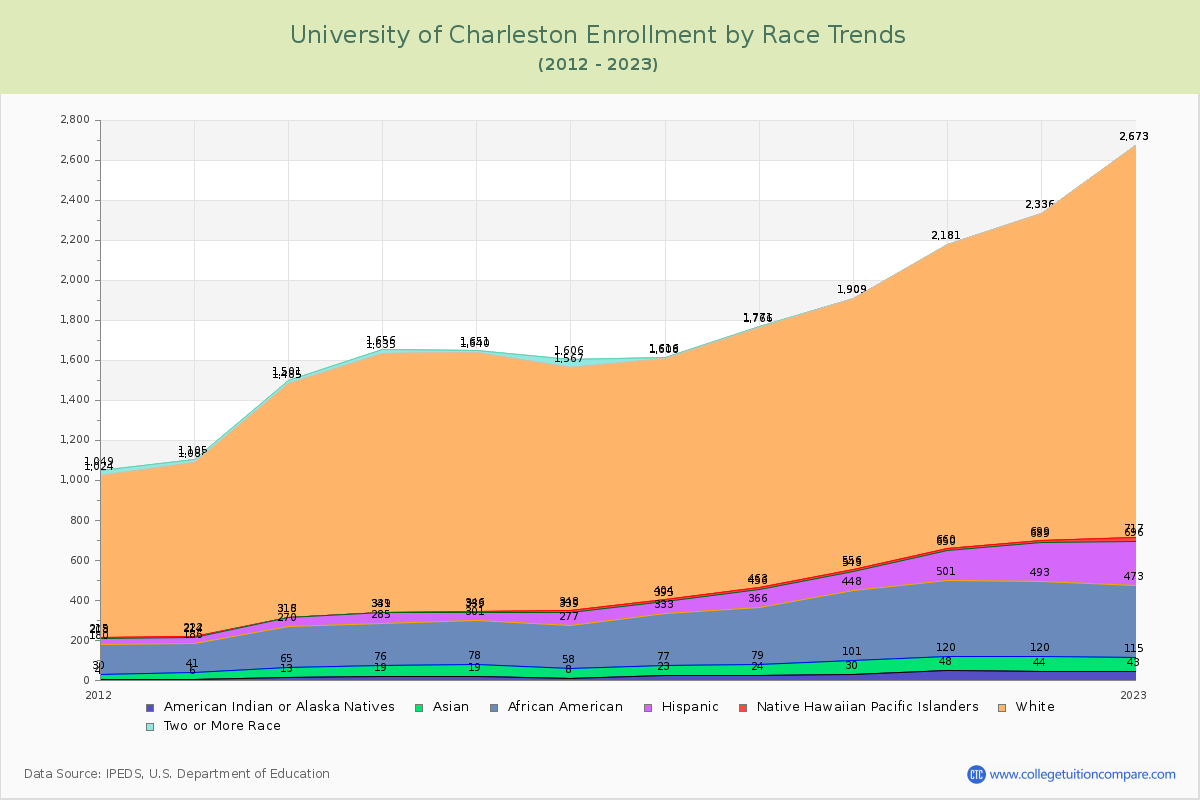
Student Population Changes
The average student population over the last 12 years is 2,454 where 3,059 students are attending the school for the academic year 2022-2023.
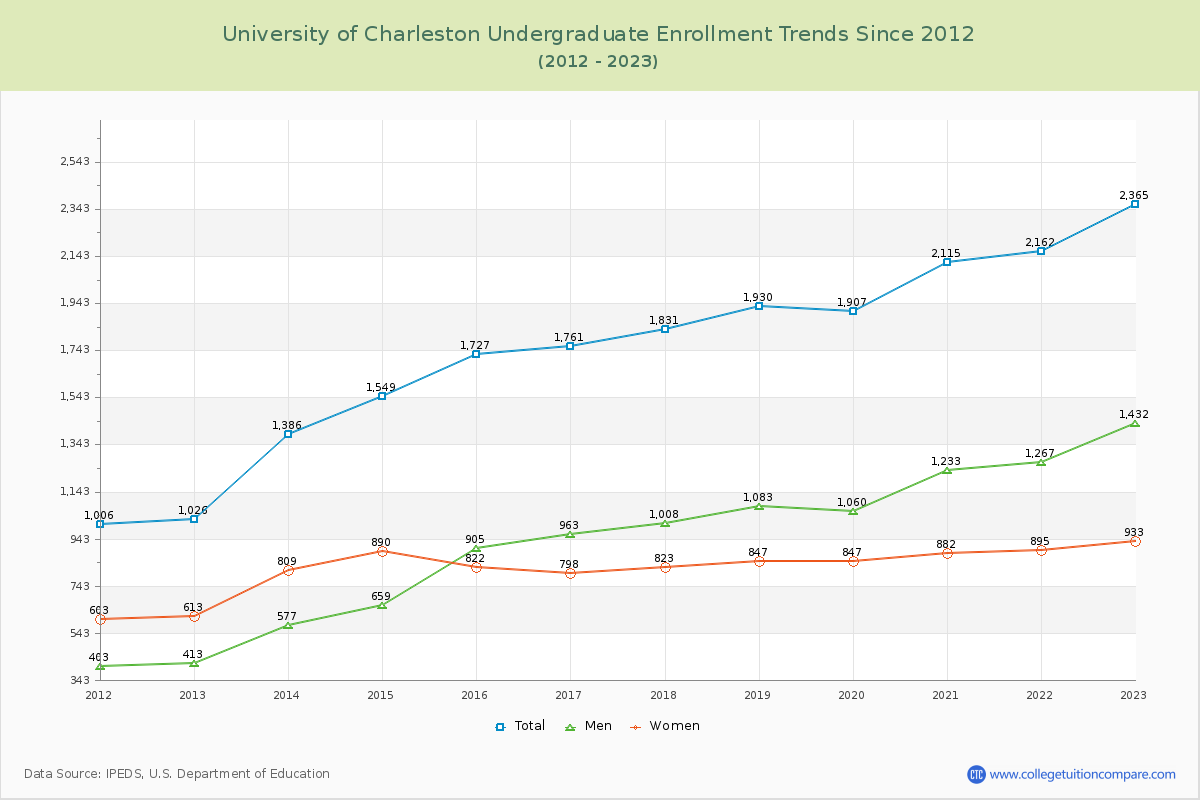
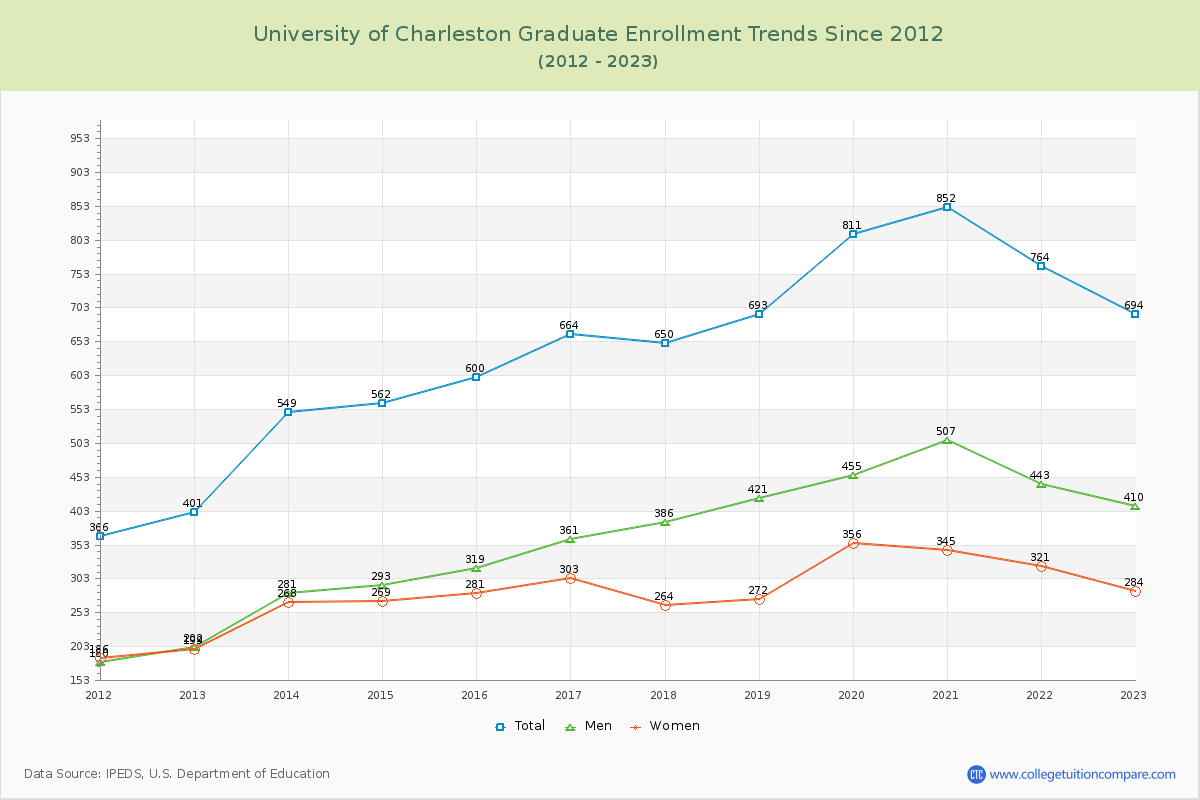
77.31% of total students is undergraduate students and 22.69% students is graduate students. The number of undergraduate students has increased by 1,339 and the graduate enrollment has increased by 293 over past 10 years.
The female to male ratio is 0.66 to 1 and it means that there are more male students enrolled in U of Charleston than female students.
The following table and chart illustrate the changes in student population by gender at University of Charleston since 2012.
| Year | Total | Undergraduate | Graduate | ||||
|---|---|---|---|---|---|---|---|
| Total | Men | Women | Total | Men | Women | ||
| 2012-13 | 1,427 | 1,026 | 413 | 613 | 401 | 202 | 199 |
| 2013-14 | 1,935 508 | 1,386 360 | 577 164 | 809 196 | 549 148 | 281 79 | 268 69 |
| 2014-15 | 2,111 176 | 1,549 163 | 659 82 | 890 81 | 562 13 | 293 12 | 269 1 |
| 2015-16 | 2,327 216 | 1,727 178 | 905 246 | 822 -68 | 600 38 | 319 26 | 281 12 |
| 2016-17 | 2,425 98 | 1,761 34 | 963 58 | 798 -24 | 664 64 | 361 42 | 303 22 |
| 2017-18 | 2,481 56 | 1,831 70 | 1,008 45 | 823 25 | 650 -14 | 386 25 | 264 -39 |
| 2018-19 | 2,623 142 | 1,930 99 | 1,083 75 | 847 24 | 693 43 | 421 35 | 272 8 |
| 2019-20 | 2,718 95 | 1,907 -23 | 1,060 -23 | 847 0 | 811 118 | 455 34 | 356 84 |
| 2020-21 | 2,967 249 | 2,115 208 | 1,233 173 | 882 35 | 852 41 | 507 52 | 345 -11 |
| 2021-22 | 2,926 -41 | 2,162 47 | 1,267 34 | 895 13 | 764 -88 | 443 -64 | 321 -24 |
| 2022-23 | 3,059 133 | 2,365 203 | 1,432 165 | 933 38 | 694 -70 | 410 -33 | 284 -37 |
| Average | 2,454 | 1,796 | 964 | 833 | 658 | 371 | 287 |