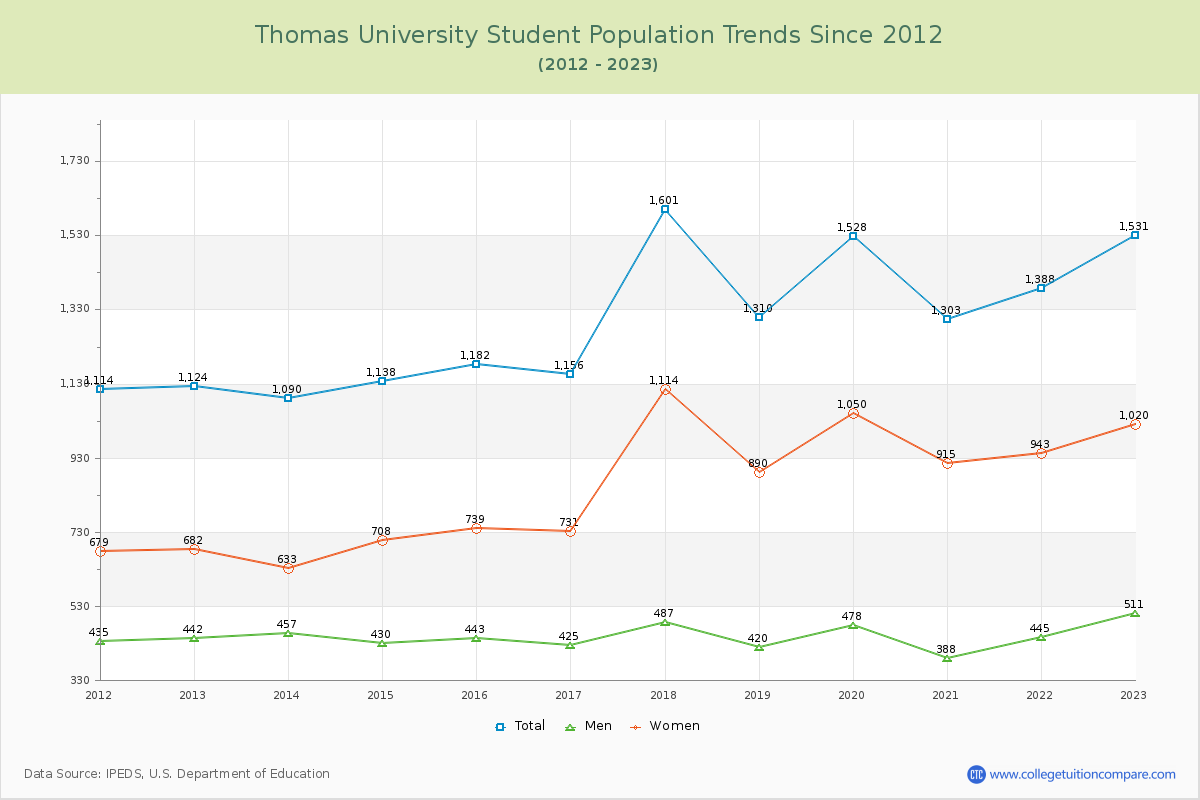
Student Population Changes
The average student population over the last 12 years is 1,305 where 1,531 students are attending the school for the academic year 2022-2023.
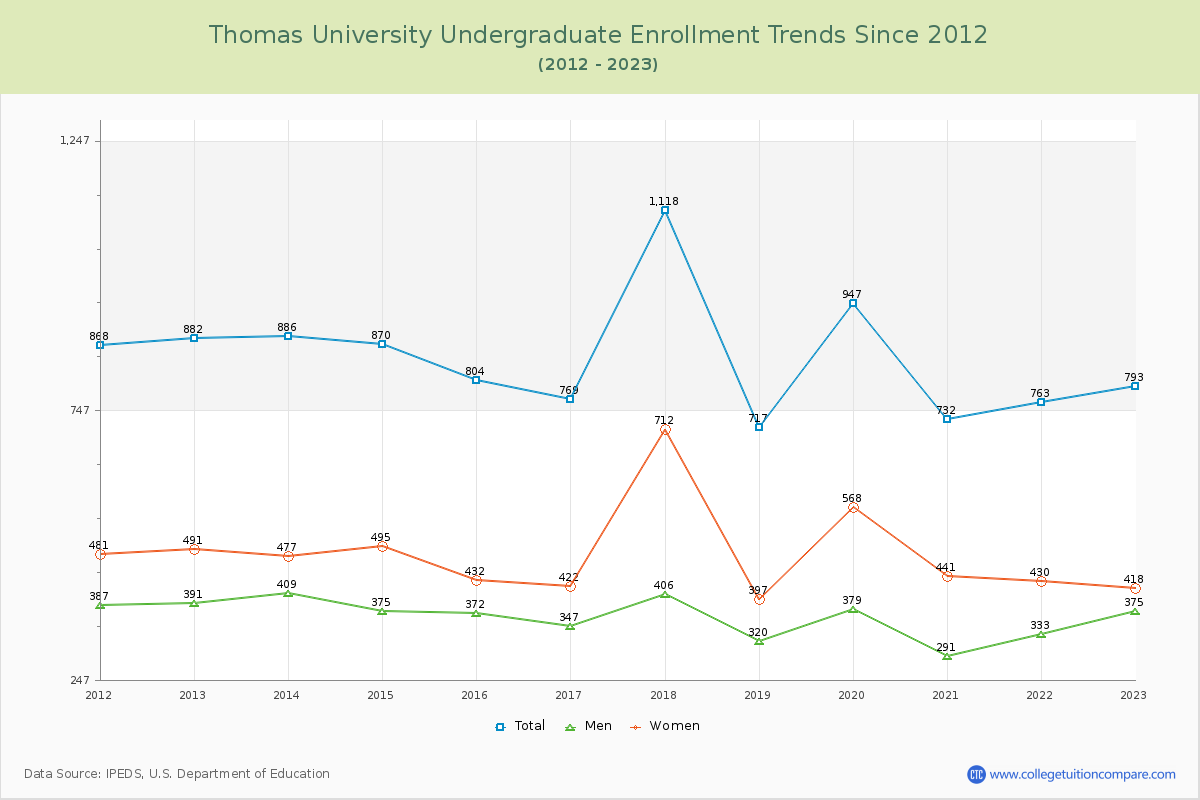
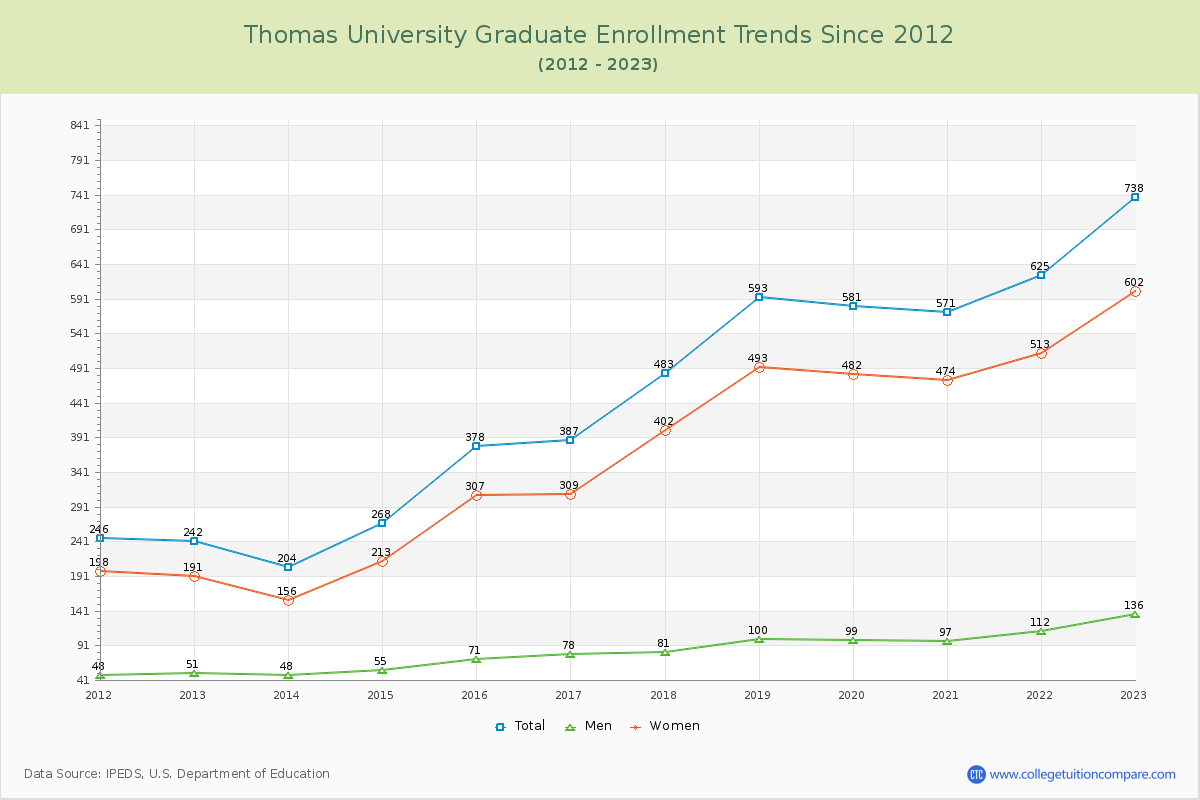
51.80% of total students is undergraduate students and 48.20% students is graduate students. The number of undergraduate students has decreased by 89 and the graduate enrollment has increased by 496 over past 10 years.
The female to male ratio is 2.00 to 1 and it means that there are more female students enrolled in TU than male students.
The following table and chart illustrate the changes in student population by gender at Thomas University since 2012.
| Year | Total | Undergraduate | Graduate | ||||
|---|---|---|---|---|---|---|---|
| Total | Men | Women | Total | Men | Women | ||
| 2012-13 | 1,124 | 882 | 391 | 491 | 242 | 51 | 191 |
| 2013-14 | 1,090 -34 | 886 4 | 409 18 | 477 -14 | 204 -38 | 48 -3 | 156 -35 |
| 2014-15 | 1,138 48 | 870 -16 | 375 -34 | 495 18 | 268 64 | 55 7 | 213 57 |
| 2015-16 | 1,182 44 | 804 -66 | 372 -3 | 432 -63 | 378 110 | 71 16 | 307 94 |
| 2016-17 | 1,156 -26 | 769 -35 | 347 -25 | 422 -10 | 387 9 | 78 7 | 309 2 |
| 2017-18 | 1,601 445 | 1,118 349 | 406 59 | 712 290 | 483 96 | 81 3 | 402 93 |
| 2018-19 | 1,310 -291 | 717 -401 | 320 -86 | 397 -315 | 593 110 | 100 19 | 493 91 |
| 2019-20 | 1,528 218 | 947 230 | 379 59 | 568 171 | 581 -12 | 99 -1 | 482 -11 |
| 2020-21 | 1,303 -225 | 732 -215 | 291 -88 | 441 -127 | 571 -10 | 97 -2 | 474 -8 |
| 2021-22 | 1,388 85 | 763 31 | 333 42 | 430 -11 | 625 54 | 112 15 | 513 39 |
| 2022-23 | 1,531 143 | 793 30 | 375 42 | 418 -12 | 738 113 | 136 24 | 602 89 |
| Average | 1,305 | 844 | 363 | 480 | 461 | 84 | 377 |