SAT Scores Over Time

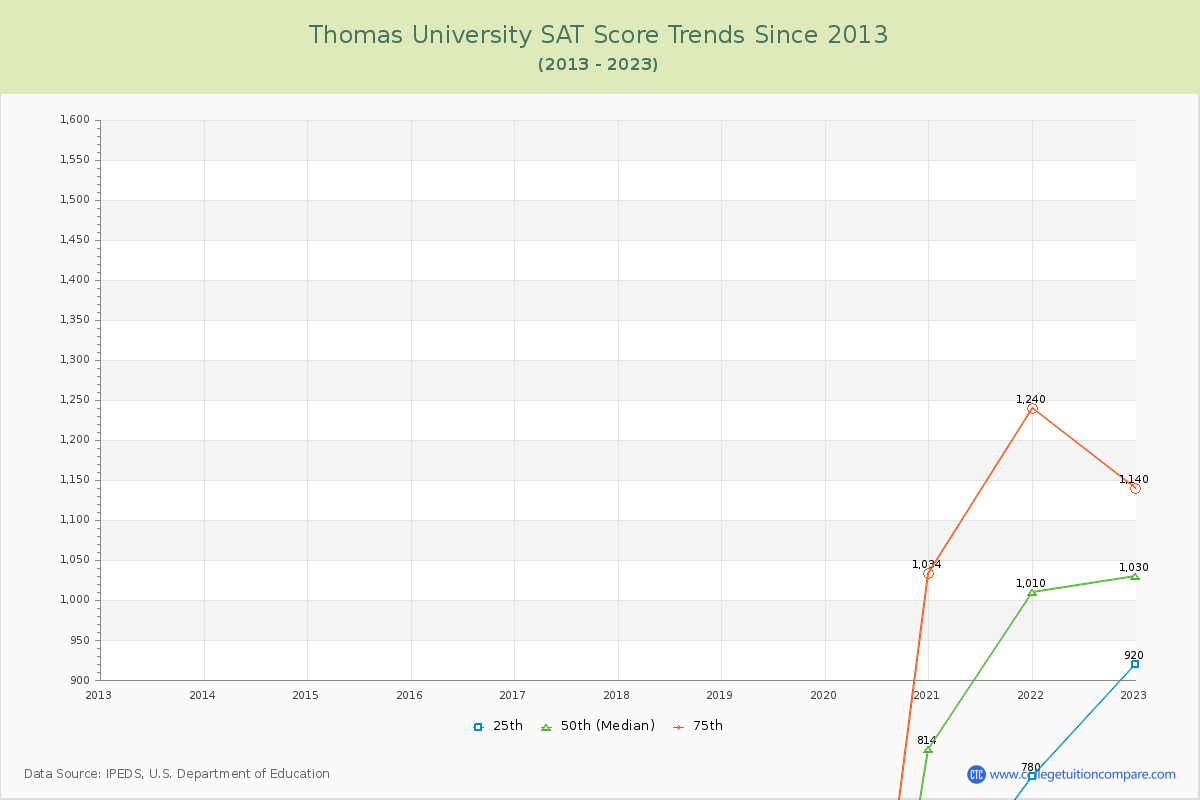
The 2023 SAT score is 1030 at TU. Over the past 4 years, the average SAT score is 765 (25th percentile) and 1138 (75th percentile). Compared to similar schools, the submitted SAT scores are around national average at TU.
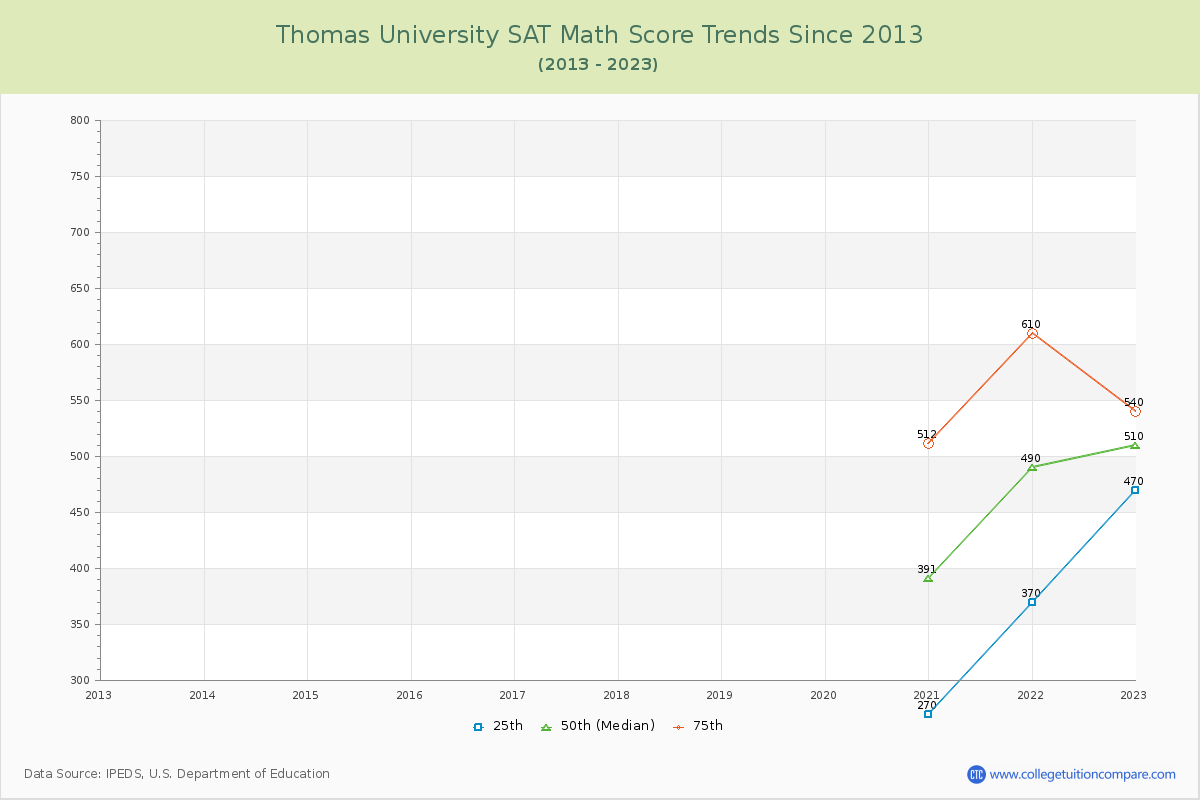
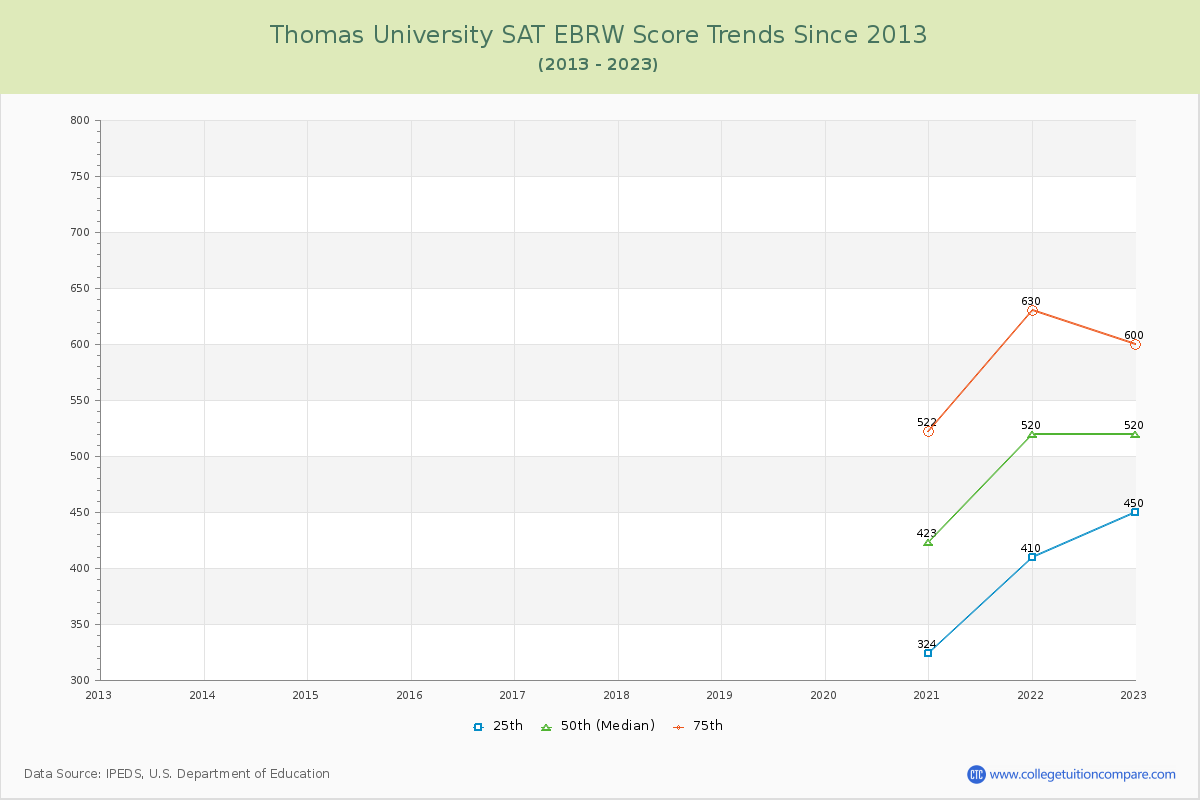
The following table and chart illustrate the changes in SAT scores at Thomas University since 2020.
TableInteractive ChartSAT Score TrendsSAT Math TrendsSAT EBRW Trends
YearTotalMathEvidence-Based Reading and Writing
25th50th75th25th50th75th25th50th75th
2020-215948141,034270391512324423522
2021-227801,0101,240370490610410520630
2022-239201,0301,140470510540450520600
Average7659511138370464554395488584
SAT Scores Over Time of Thomas University
Thomas University SAT Score Trends Chart
Thomas University SAT Math Score Trends Chart
Thomas University SAT EBRW (Evidence-Based Reading and Writing) Trends Chart
*SAT Evidence-Based Reading and Writing replaces SAT critical reading and writing since year 2017.
**The SAT Writing score is excluded from the total scores for year from 2011 to 2016.
ACT Scores Over Time

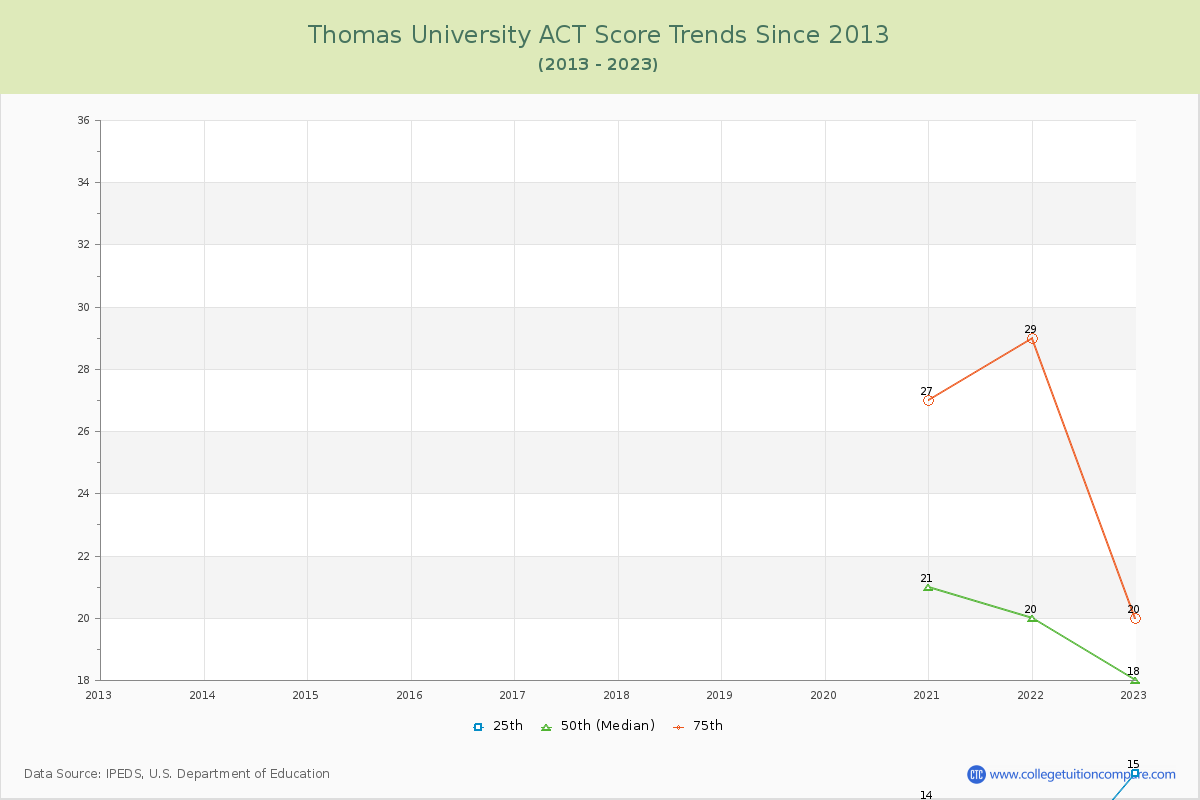
The 2023 ACT score is 18 at TU. Over the past 4 years, the average ACT score of the last 4 years is 13 (25th percentile) and 25 (75th percentile). Compared to similar schools, the submitted ACT scores are around national average at TU.
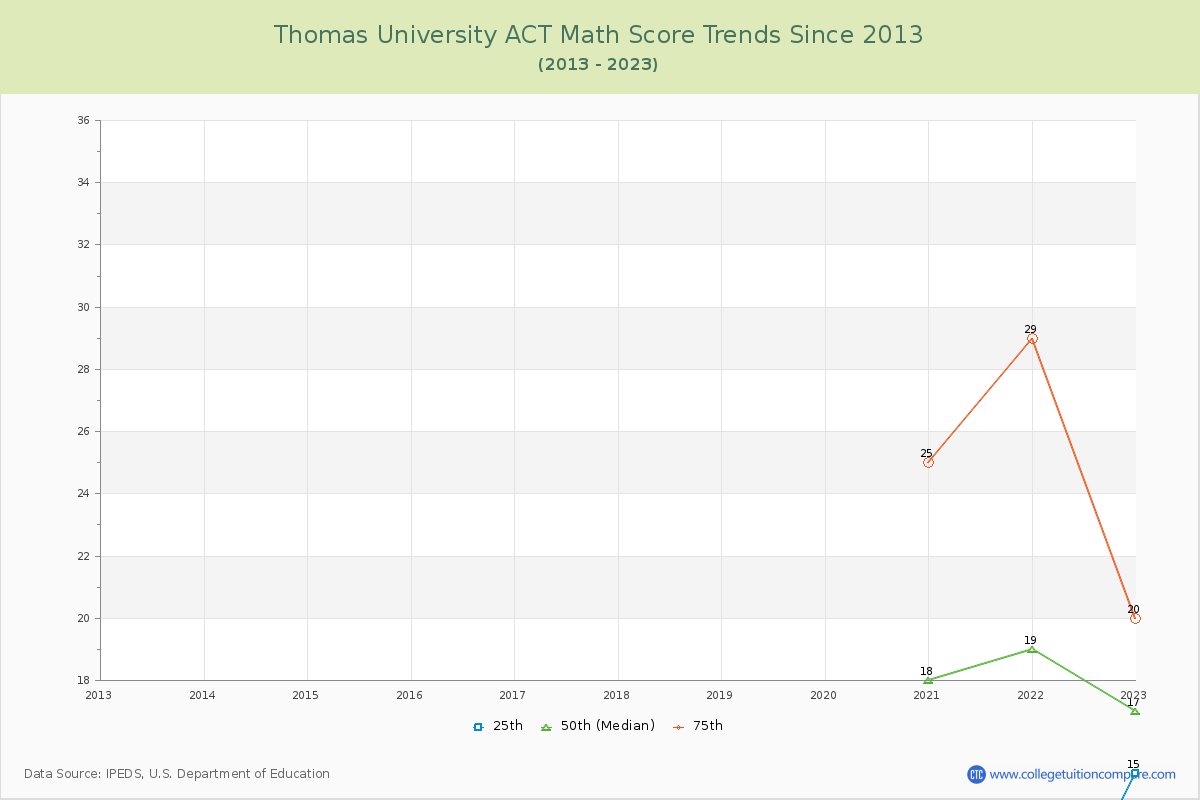
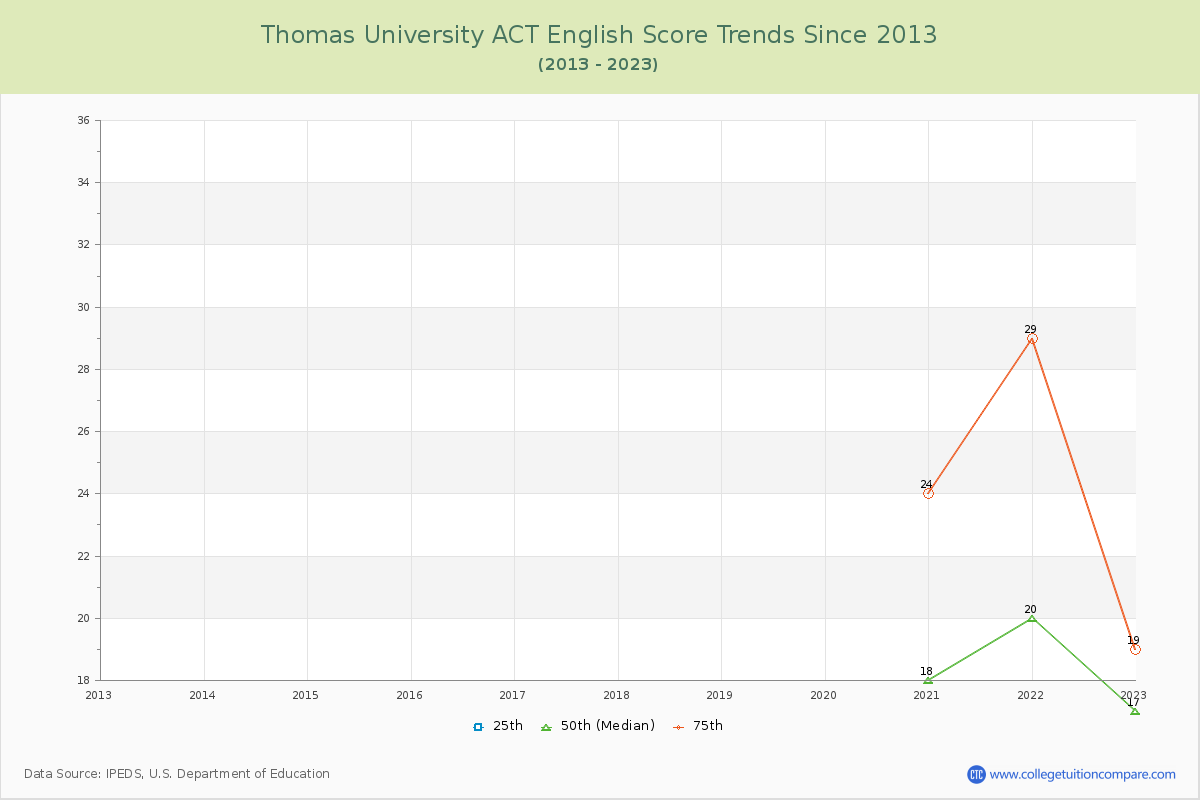
The following table and chart show the changes in ACT scores at Thomas University since 2020.
TableInteractive ChartACT Score TrendsACT Math TrendsACT English Trends
YearCompositeEnglishMath
25th50th75th25th50th75th25th50th75th
2020-21142127121824111825
2021-2211202910202981929
2022-23151820131719151720
Average132025121824111825
ACT Scores Over Time of Thomas University
Thomas University ACT Score Trends Chart
Thomas University ACT Math Score Trends Chart
Thomas University ACT English Trends Chart
*SAT Evidence-Based Reading and Writing replaces SAT critical reading and writing since year 2017.
**The SAT Writing score is excluded from the total scores for year from 2011 to 2016.
Related Articles and Ads