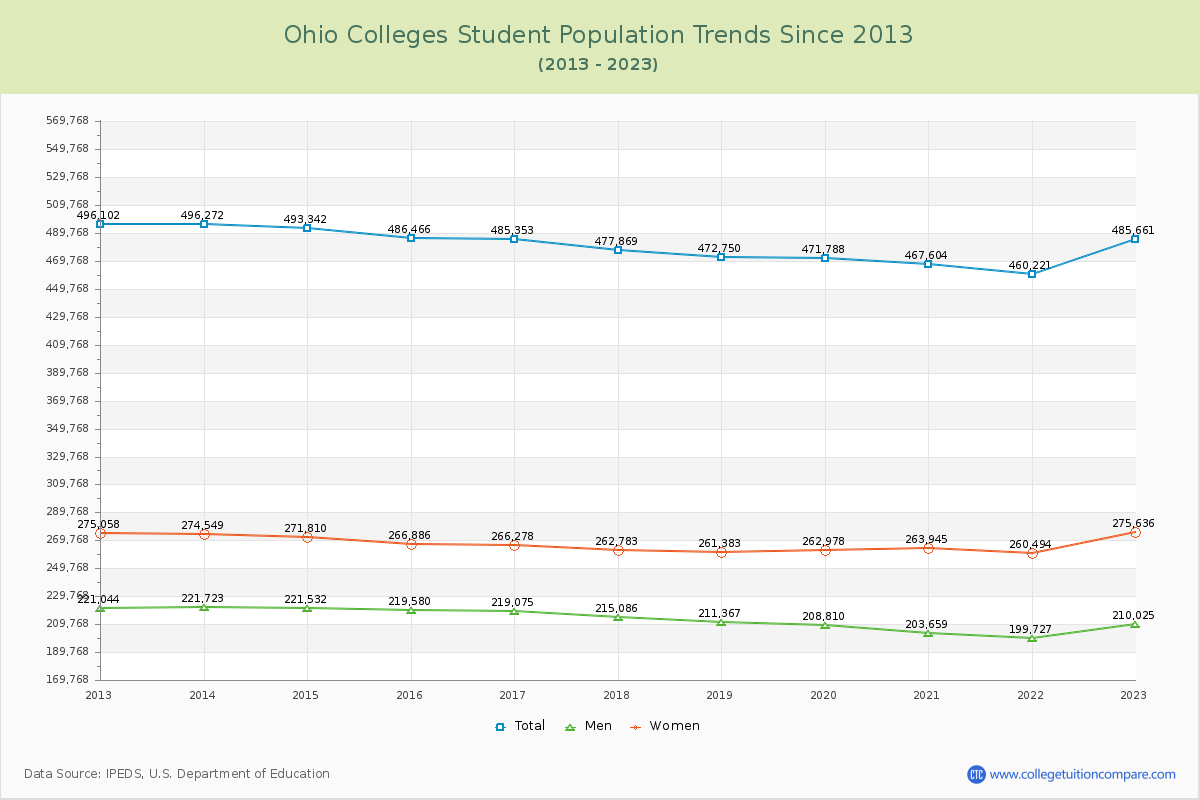
Student Population Changes
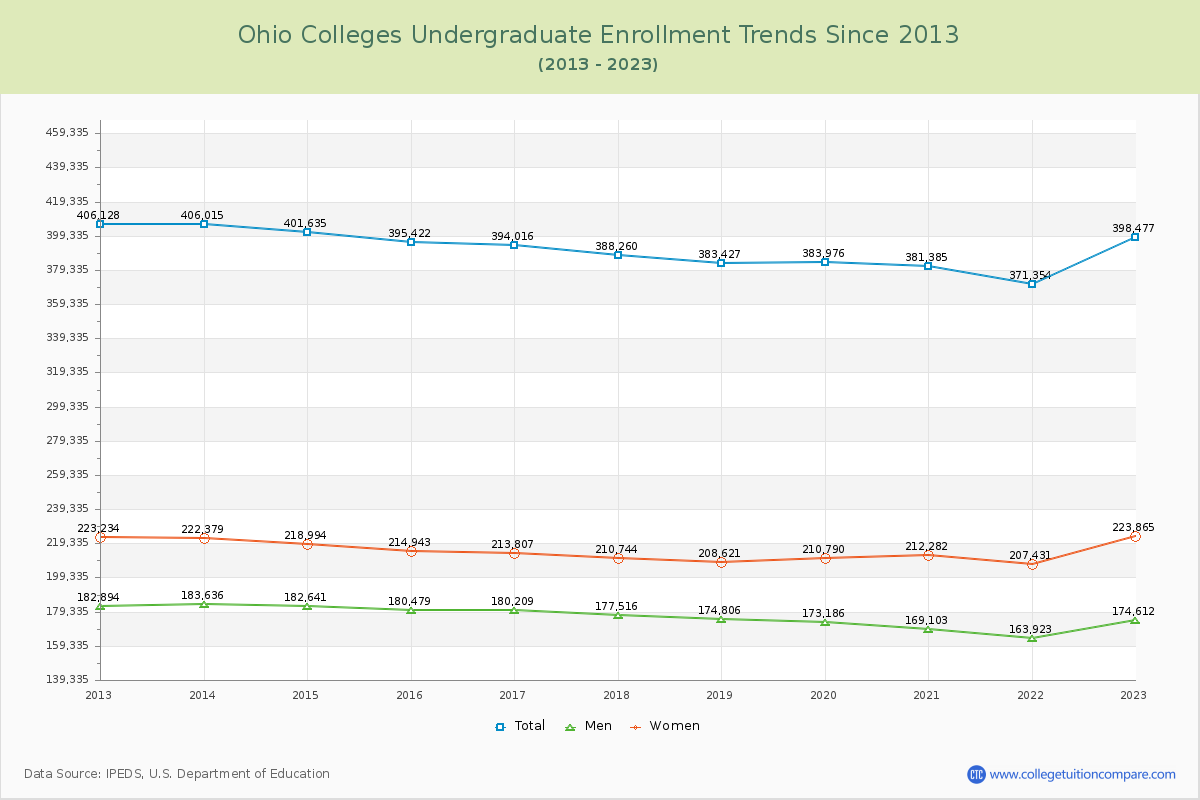
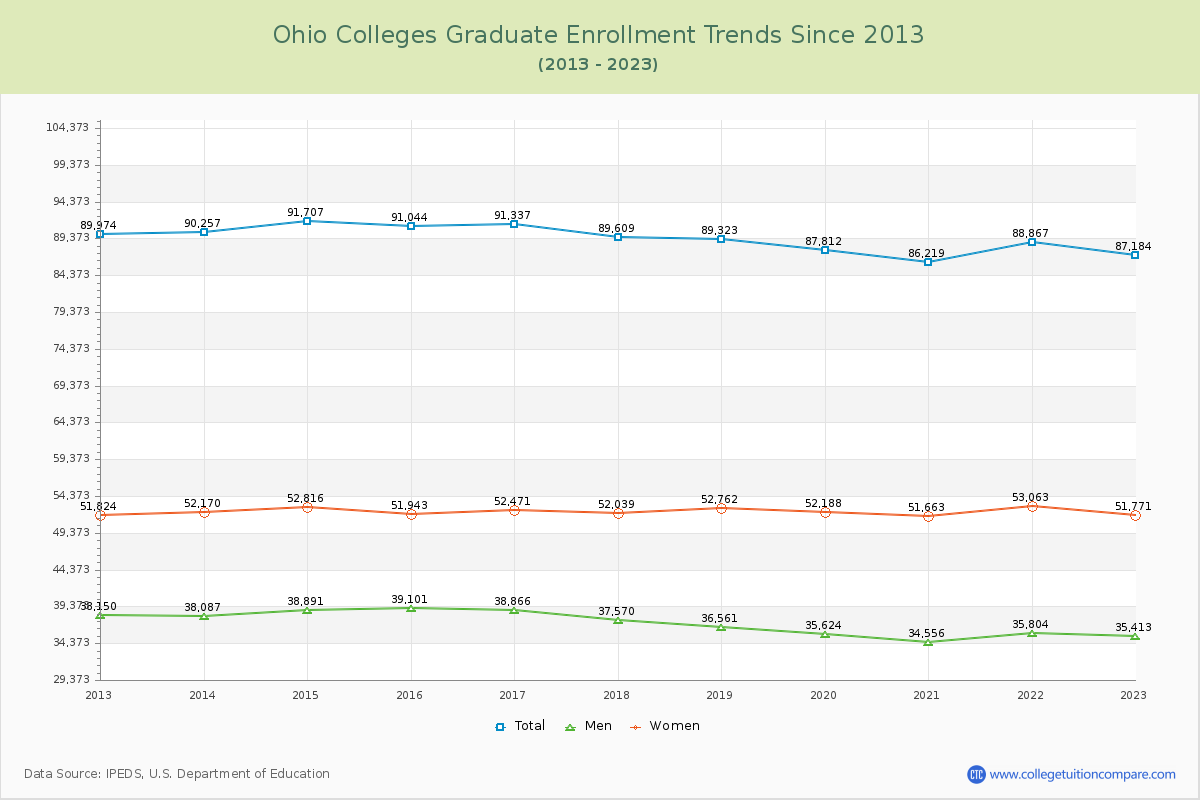
The average number of students over the past 11 years is 481,221, and 485,661 students were attending the schools in the academic year 2022-2023. Of the total students, 82.05% are undergraduate students and 17.95% are graduate students. Over the past 11, the number of undergraduate students decreased by 7,651, and the graduate student enrollment decreased by 2,790.
The female to male ratio is 1.31 to 1, meaning that there are more female students enrolled in Ohio Colleges than male students.
The following table and chart illustrate the changes in student population by gender at Ohio Colleges since 2013.
| Year | Total | Undergraduate | Graduate | ||||
|---|---|---|---|---|---|---|---|
| Total | Men | Women | Total | Men | Women | ||
| 2012-13 | 496,102 | 406,128 | 182,894 | 223,234 | 89,974 | 38,150 | 51,824 |
| 2013-14 | 496,272 170 | 406,015 -113 | 183,636 742 | 222,379 -855 | 90,257 283 | 38,087 -63 | 52,170 346 |
| 2014-15 | 493,342 -2,930 | 401,635 -4,380 | 182,641 -995 | 218,994 -3,385 | 91,707 1,450 | 38,891 804 | 52,816 646 |
| 2015-16 | 486,466 -6,876 | 395,422 -6,213 | 180,479 -2,162 | 214,943 -4,051 | 91,044 -663 | 39,101 210 | 51,943 -873 |
| 2016-17 | 485,353 -1,113 | 394,016 -1,406 | 180,209 -270 | 213,807 -1,136 | 91,337 293 | 38,866 -235 | 52,471 528 |
| 2017-18 | 477,869 -7,484 | 388,260 -5,756 | 177,516 -2,693 | 210,744 -3,063 | 89,609 -1,728 | 37,570 -1,296 | 52,039 -432 |
| 2018-19 | 472,750 -5,119 | 383,427 -4,833 | 174,806 -2,710 | 208,621 -2,123 | 89,323 -286 | 36,561 -1,009 | 52,762 723 |
| 2019-20 | 471,788 -962 | 383,976 549 | 173,186 -1,620 | 210,790 2,169 | 87,812 -1,511 | 35,624 -937 | 52,188 -574 |
| 2020-21 | 467,604 -4,184 | 381,385 -2,591 | 169,103 -4,083 | 212,282 1,492 | 86,219 -1,593 | 34,556 -1,068 | 51,663 -525 |
| 2021-22 | 460,221 -7,383 | 371,354 -10,031 | 163,923 -5,180 | 207,431 -4,851 | 88,867 2,648 | 35,804 1,248 | 53,063 1,400 |
| 2022-23 | 485,661 25,440 | 398,477 27,123 | 174,612 10,689 | 223,865 16,434 | 87,184 -1,683 | 35,413 -391 | 51,771 -1,292 |
| Average | 481,221 | 391,827 | 176,637 | 215,190 | 89,394 | 37,148 | 52,246 |