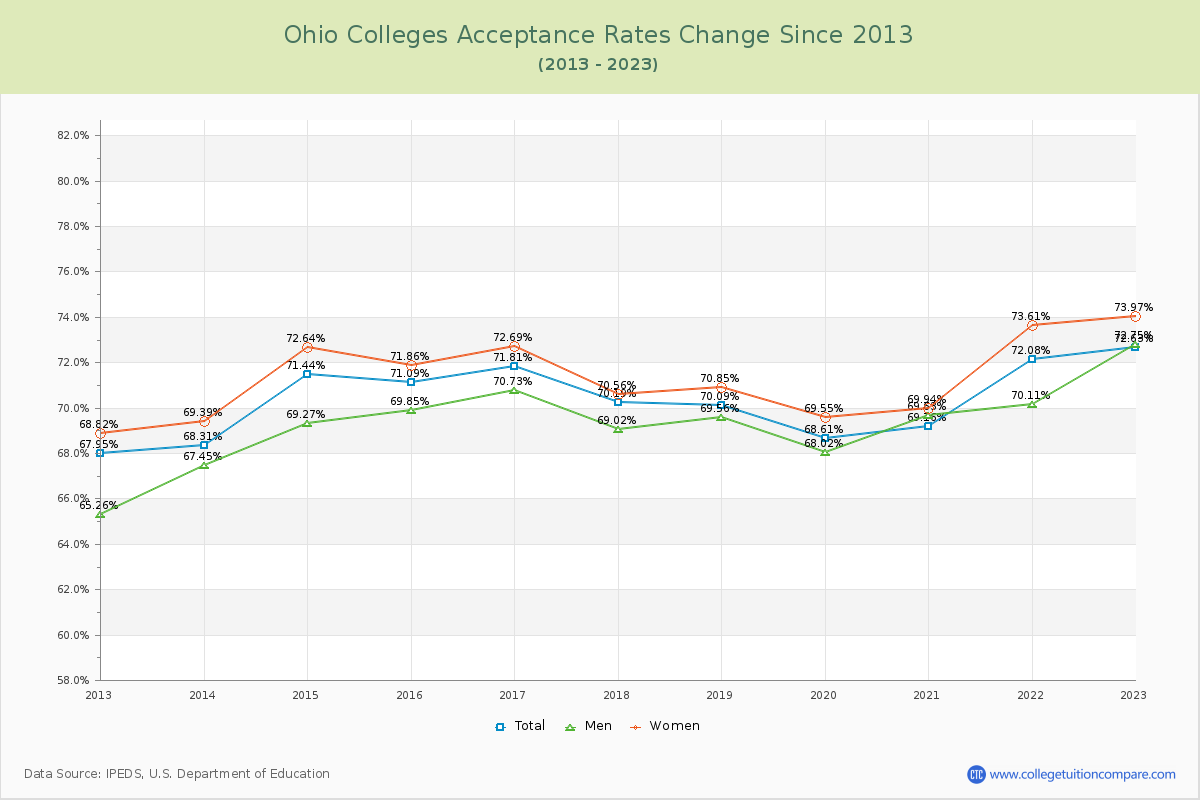
Acceptance Rate Changes
The average acceptance rate over the last 10 years is 70.31% where the current academic year rate is 72.63% at Ohio Colleges. By gender, men students' acceptance rate is 69.24% and women students' rate is 71.26%. The next table and chart illustrate the acceptance rates changes at Ohio Colleges over the past 11 years (2012-2023).
| Year | Total | Men | Women |
|---|---|---|---|
| 2012-13 | 67.95% | 65.26% | 68.82% |
| 2013-14 | 68.31% 0.35% |
67.45% 0.56% |
69.39% 0.56% |
| 2014-15 | 71.44% 3.14% |
69.27% 3.25% |
72.64% 3.25% |
| 2015-16 | 71.09% -0.35% |
69.85% -0.78% |
71.86% -0.78% |
| 2016-17 | 71.81% 0.72% |
70.73% 0.84% |
72.69% 0.84% |
| 2017-18 | 70.19% -1.62% |
69.02% -2.13% |
70.56% -2.13% |
| 2018-19 | 70.09% -0.10% |
69.56% 0.29% |
70.85% 0.29% |
| 2019-20 | 68.61% -1.49% |
68.02% -1.30% |
69.55% -1.30% |
| 2020-21 | 69.16% 0.56% |
69.63% 0.39% |
69.94% 0.39% |
| 2021-22 | 72.08% 2.92% |
70.11% 3.67% |
73.61% 3.67% |
| 2022-23 | 72.63% 0.55% |
72.75% 0.37% |
73.97% 0.37% |
| Average | 70.31% | 69.24% | 71.26% |