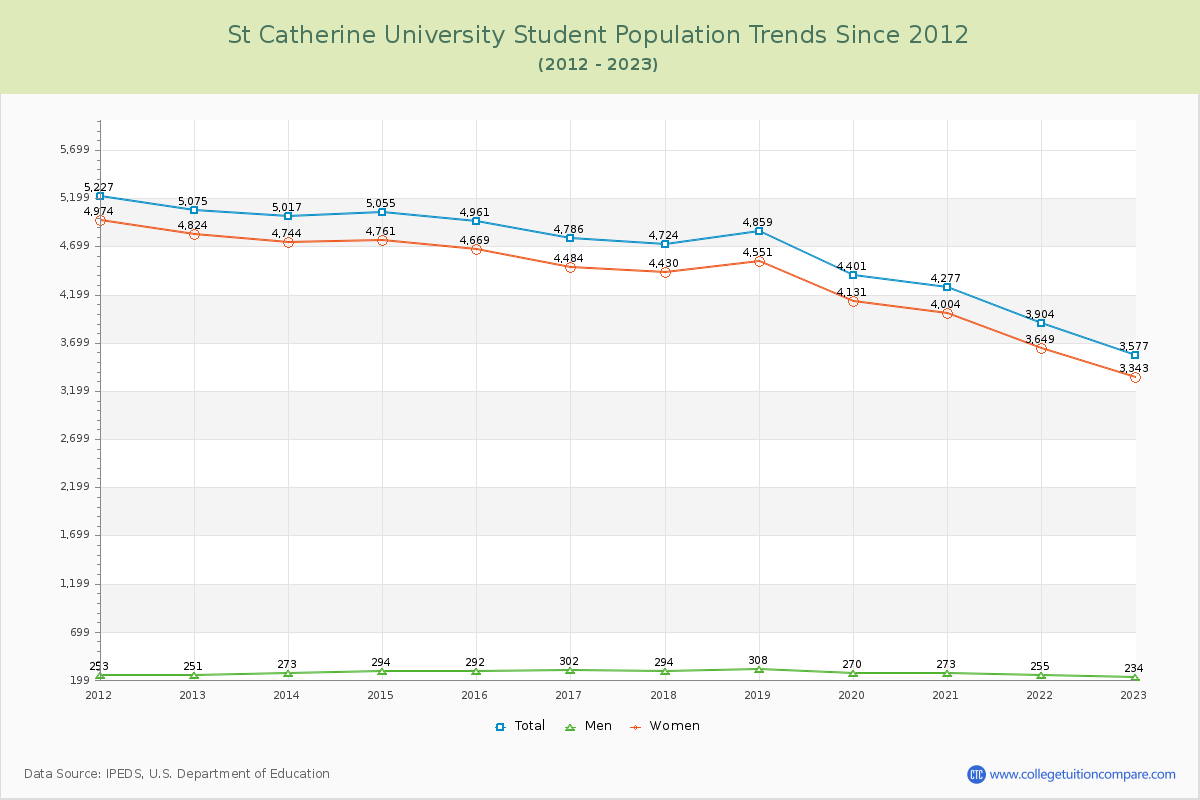
Student Population Changes
The average student population over the last 12 years is 4,603 where 3,577 students are attending the school for the academic year 2022-2023.
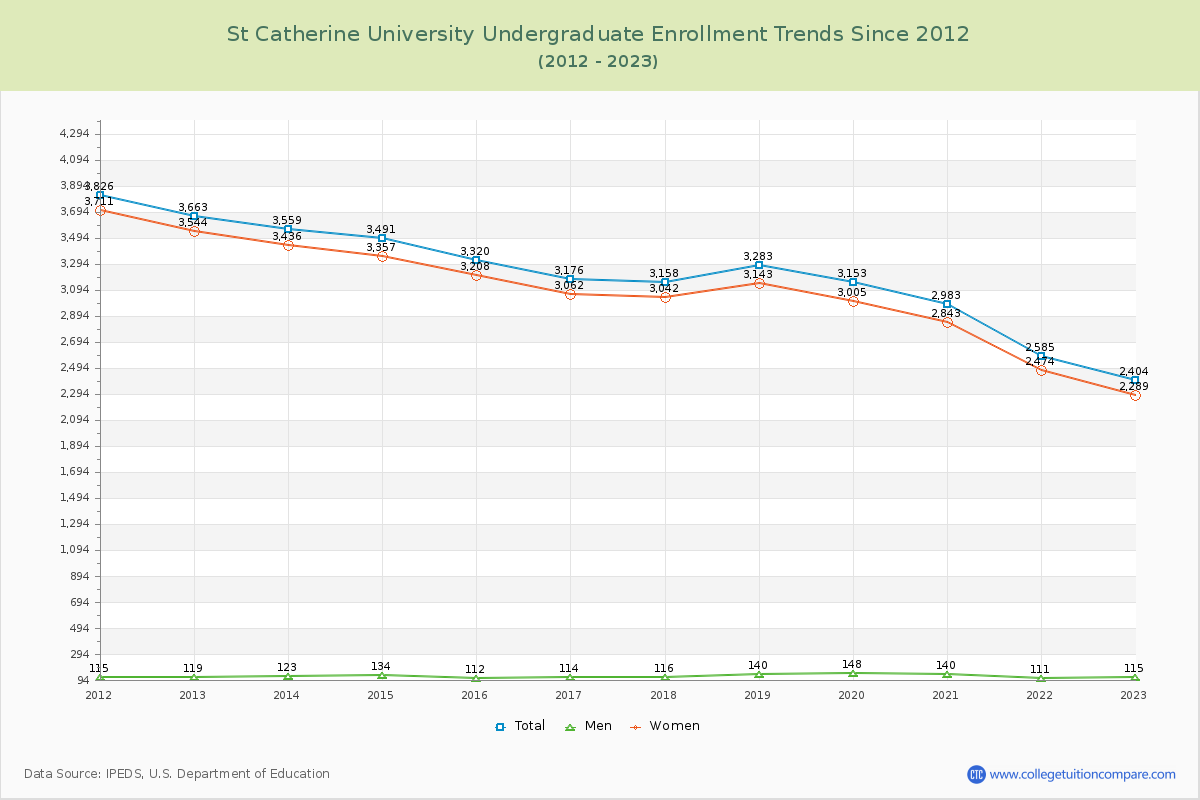
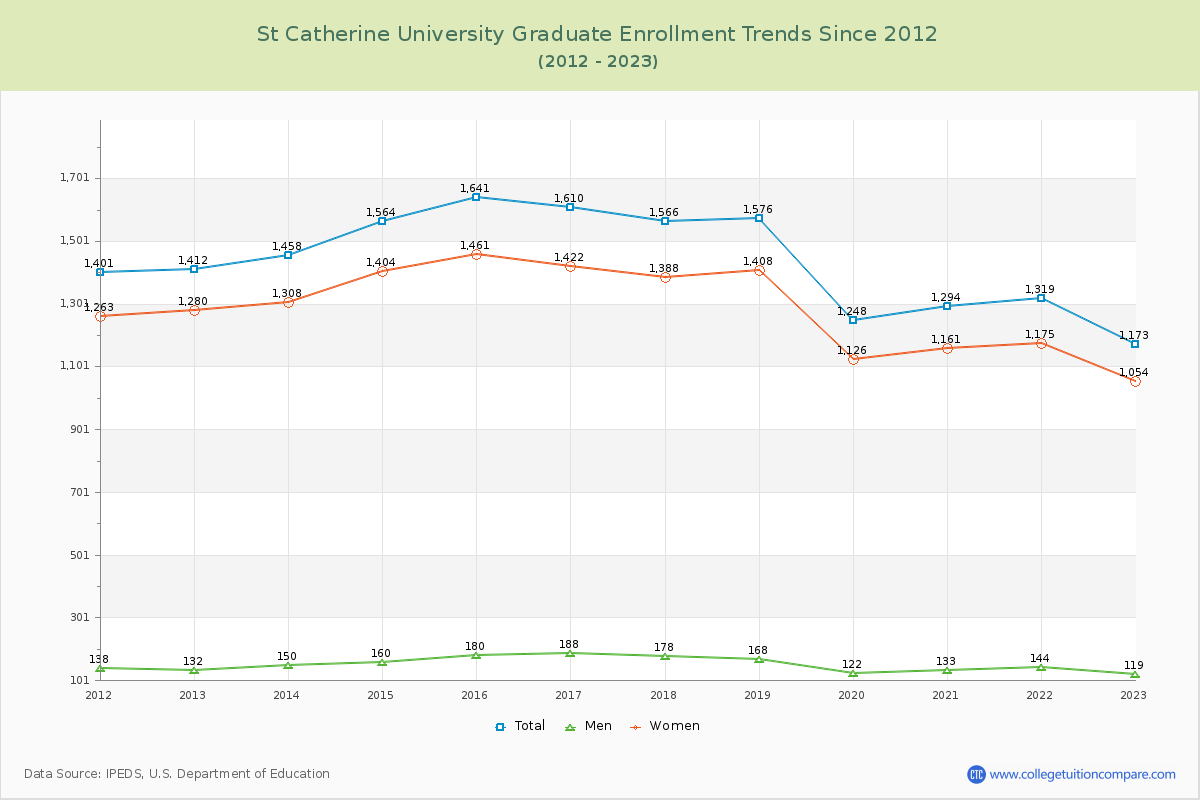
67.21% of total students is undergraduate students and 32.79% students is graduate students. The number of undergraduate students has decreased by 1,259 and the graduate enrollment has decreased by 239 over past 10 years.
The following table and chart illustrate the changes in student population by gender at St Catherine University since 2012.
| Year | Total | Undergraduate | Graduate | ||||
|---|---|---|---|---|---|---|---|
| Total | Men | Women | Total | Men | Women | ||
| 2012-13 | 5,075 | 3,663 | 119 | 3,544 | 1,412 | 132 | 1,280 |
| 2013-14 | 5,017 -58 | 3,559 -104 | 123 4 | 3,436 -108 | 1,458 46 | 150 18 | 1,308 28 |
| 2014-15 | 5,055 38 | 3,491 -68 | 134 11 | 3,357 -79 | 1,564 106 | 160 10 | 1,404 96 |
| 2015-16 | 4,961 -94 | 3,320 -171 | 112 -22 | 3,208 -149 | 1,641 77 | 180 20 | 1,461 57 |
| 2016-17 | 4,786 -175 | 3,176 -144 | 114 2 | 3,062 -146 | 1,610 -31 | 188 8 | 1,422 -39 |
| 2017-18 | 4,724 -62 | 3,158 -18 | 116 2 | 3,042 -20 | 1,566 -44 | 178 -10 | 1,388 -34 |
| 2018-19 | 4,859 135 | 3,283 125 | 140 24 | 3,143 101 | 1,576 10 | 168 -10 | 1,408 20 |
| 2019-20 | 4,401 -458 | 3,153 -130 | 148 8 | 3,005 -138 | 1,248 -328 | 122 -46 | 1,126 -282 |
| 2020-21 | 4,277 -124 | 2,983 -170 | 140 -8 | 2,843 -162 | 1,294 46 | 133 11 | 1,161 35 |
| 2021-22 | 3,904 -373 | 2,585 -398 | 111 -29 | 2,474 -369 | 1,319 25 | 144 11 | 1,175 14 |
| 2022-23 | 3,577 -327 | 2,404 -181 | 115 4 | 2,289 -185 | 1,173 -146 | 119 -25 | 1,054 -121 |
| Average | 4,603 | 3,161 | 125 | 3,037 | 1,442 | 152 | 1,290 |