Student Population by Gender
St Catherine University has a total of 3,577 enrolled students for the academic year 2022-2023. 2,404 students have enrolled in undergraduate programs and 1,173 students joined graduate programs.
By gender, 234 male and 3,343 female students (the male-female ratio is 7:93) are attending the school. The gender distribution is based on the 2022-2023 data.
| Total | Undergraduate | Graduate | |
|---|---|---|---|
| Total | 3,577 | 2,404 | 1,173 |
| Men | 234 | 115 | 119 |
| Women | 3,343 | 2,289 | 1,054 |
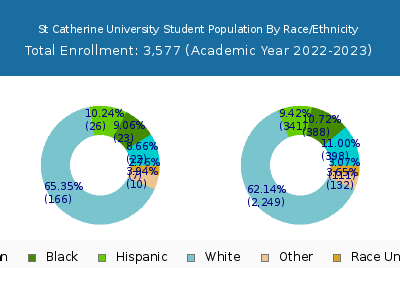
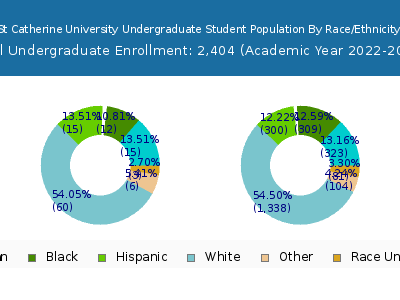
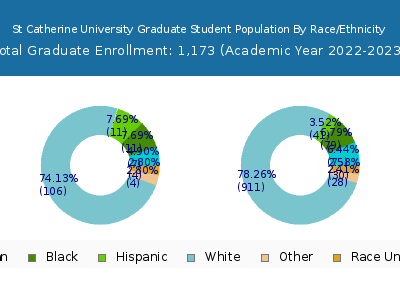
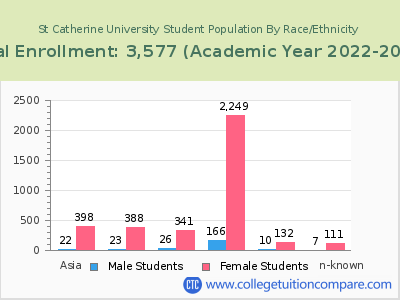
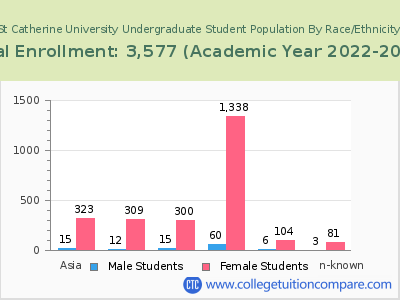
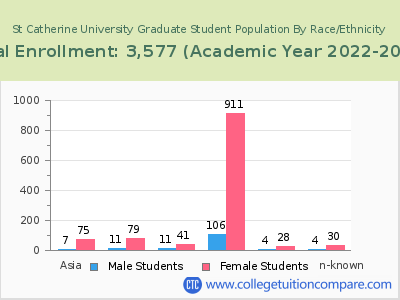
Student Distribution by Race/Ethnicity
| Race | Total | Men | Women |
|---|---|---|---|
| American Indian or Native American | 13 | 0 | 13 |
| Asian | 383 | 16 | 367 |
| Black | 416 | 29 | 387 |
| Hispanic | 336 | 19 | 317 |
| Native Hawaiian or Other Pacific Islanders | 8 | 0 | 8 |
| White | 2,163 | 147 | 2,016 |
| Two or more races | 135 | 8 | 127 |
| Race Unknown | 107 | 14 | 93 |
| Race | Total | Men | Women |
|---|---|---|---|
| American Indian or Native American | 10 | 0 | 10 |
| Asian | 303 | 10 | 293 |
| Black | 331 | 19 | 312 |
| Hispanic | 301 | 13 | 288 |
| Native Hawaiian or Other Pacific Islanders | 8 | 0 | 8 |
| White | 1,257 | 58 | 1,199 |
| Two or more races | 104 | 5 | 99 |
| Race Unknown | 80 | 10 | 70 |
| Race | Total | Men | Women |
|---|---|---|---|
| American Indian or Native American | 2 | 0 | 2 |
| Asian | 26 | 1 | 25 |
| Black | 42 | 7 | 35 |
| Hispanic | 35 | 1 | 34 |
| Native Hawaiian or Other Pacific Islanders | 0 | 0 | 0 |
| White | 154 | 12 | 142 |
| Two or more races | 12 | 2 | 10 |
| Race Unknown | 7 | 0 | 7 |
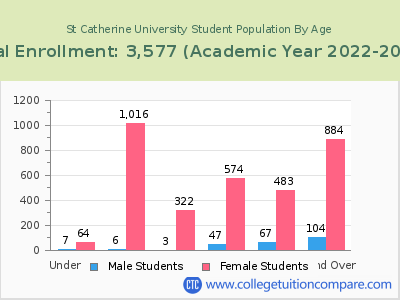
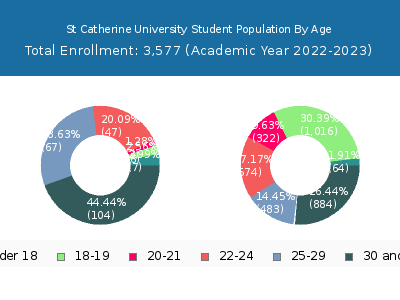
Student Age Distribution
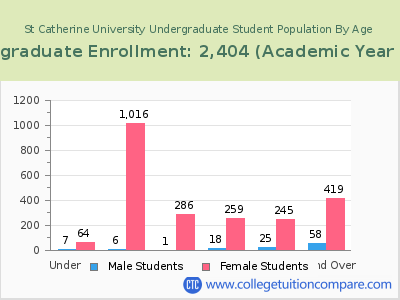
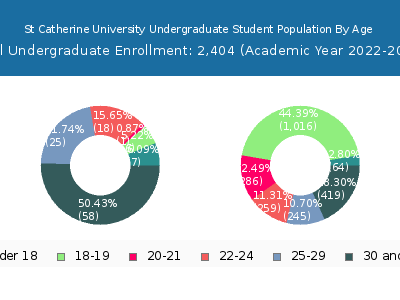
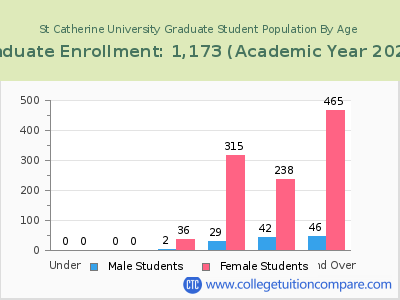
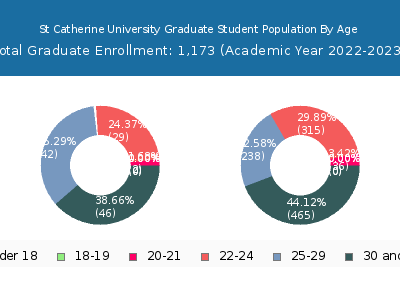
By age, St. Kate's has 71 students under 18 years old and 9 students over 65 years old. There are 2,039 students under 25 years old, and 1,538 students over 25 years old out of 3,577 total students.
In undergraduate programs, 71 students are younger than 18 and 1 students are older than 65. St. Kate's has 1,657 undergraduate students aged under 25 and 747 students aged 25 and over.
It has 382 graduate students aged under 25 and 791 students aged 25 and over.
| Age | Total | Men | Women |
|---|---|---|---|
| Under 18 | 71 | 64 | 7 |
| 18-19 | 1,022 | 1,016 | 6 |
| 20-21 | 325 | 322 | 3 |
| 22-24 | 621 | 574 | 47 |
| 25-29 | 550 | 483 | 67 |
| 30-34 | 326 | 289 | 37 |
| 35-39 | 245 | 216 | 29 |
| 40-49 | 283 | 256 | 27 |
| 50-64 | 125 | 114 | 11 |
| Over 65 | 9 | 9 | 0 |
| Age | Total | Men | Women |
|---|---|---|---|
| Under 18 | 71 | 64 | 7 |
| 18-19 | 1,022 | 1,016 | 6 |
| 20-21 | 287 | 286 | 1 |
| 22-24 | 277 | 259 | 18 |
| 25-29 | 270 | 245 | 25 |
| 30-34 | 170 | 152 | 18 |
| 35-39 | 125 | 107 | 18 |
| 40-49 | 135 | 118 | 17 |
| 50-64 | 46 | 41 | 5 |
| Over 65 | 1 | 1 | 0 |
| Age | Total | Men | Women |
|---|
Online Student Enrollment
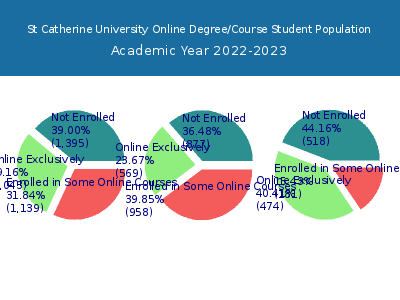
Distance learning, also called online education, is very attractive to students, especially who want to continue education and work in field. At St Catherine University, 1,043 students are enrolled exclusively in online courses and 1,139 students are enrolled in some online courses.
669 students lived in Minnesota or jurisdiction in which the school is located are enrolled exclusively in online courses and 374 students live in other State or outside of the United States.
| All Students | Enrolled Exclusively Online Courses | Enrolled in Some Online Courses | |
|---|---|---|---|
| All Students | 3,577 | 1,043 | 1,139 |
| Undergraduate | 2,404 | 569 | 958 |
| Graduate | 1,173 | 474 | 181 |
| Minnesota Residents | Other States in U.S. | Outside of U.S. | |
|---|---|---|---|
| All Students | 669 | 371 | 3 |
| Undergraduate | 262 | 307 | 0 |
| Graduate | 407 | 64 | 3 |
Transfer-in Students (Undergraduate)
Among 2,404 enrolled in undergraduate programs, 278 students have transferred-in from other institutions. The percentage of transfer-in students is 11.56%.128 students have transferred in as full-time status and 150 students transferred in as part-time status.
| Number of Students | |
|---|---|
| Regular Full-time | 1,496 |
| Transfer-in Full-time | 128 |
| Regular Part-time | 630 |
| Transfer-in Part-time | 150 |
