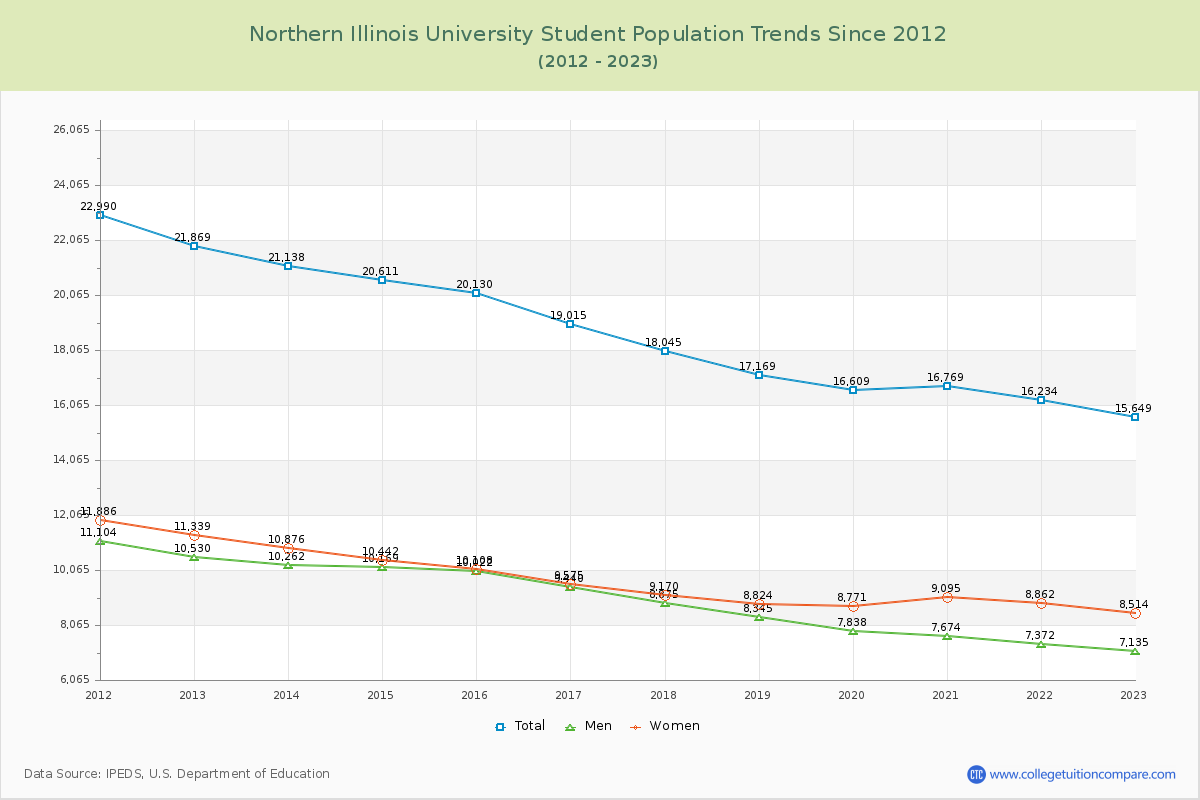
Student Population Changes
The average student population over the last 12 years is 18,476 where 15,649 students are attending the school for the academic year 2022-2023.
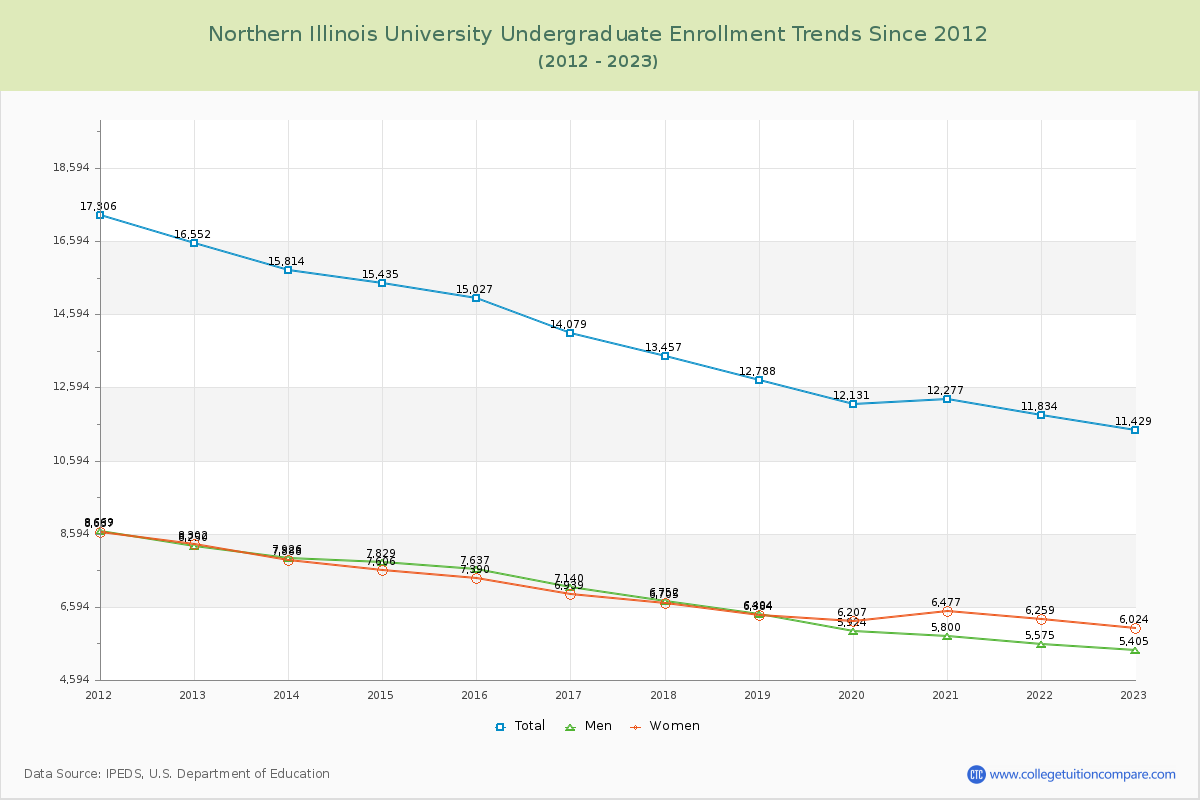
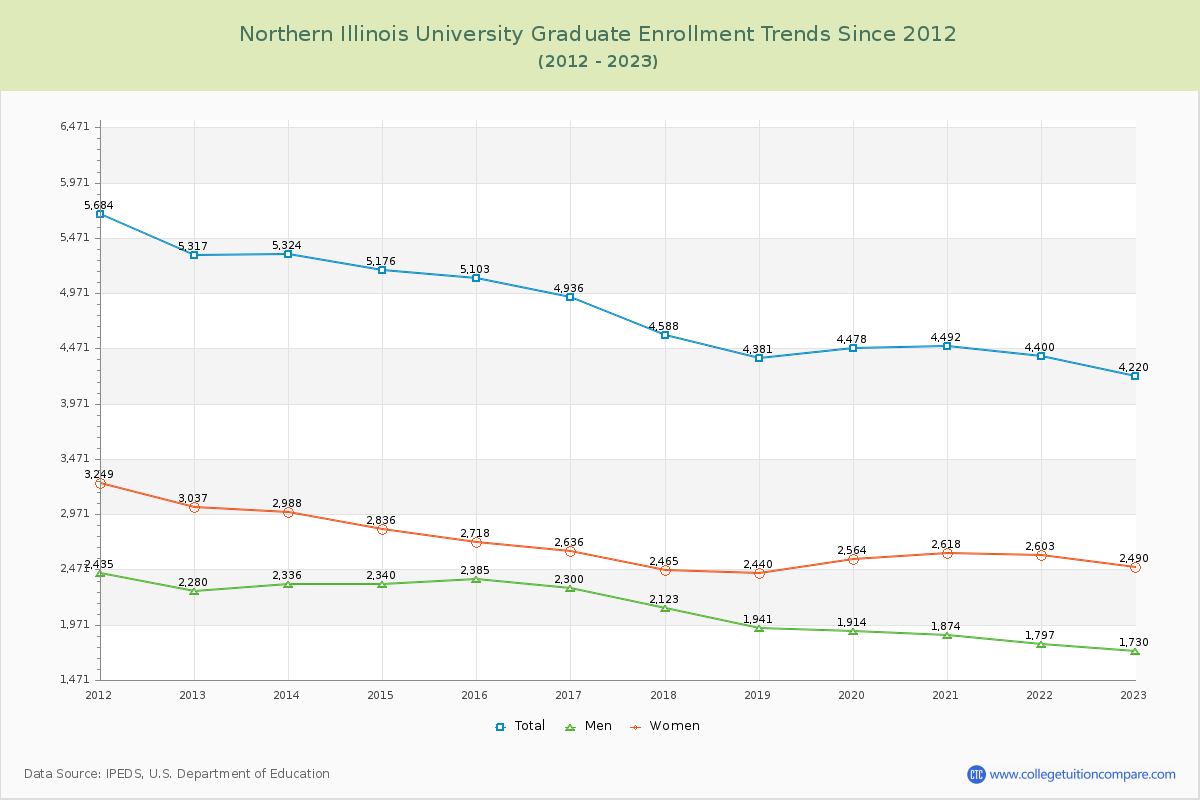
73.03% of total students is undergraduate students and 26.97% students is graduate students. The number of undergraduate students has decreased by 5,123 and the graduate enrollment has decreased by 1,097 over past 10 years.
The female to male ratio is 1.19 to 1 and it means that there are slightly more female students enrolled in Northern Illinois than male students.
The following table and chart illustrate the changes in student population by gender at Northern Illinois University since 2012.
| Year | Total | Undergraduate | Graduate | ||||
|---|---|---|---|---|---|---|---|
| Total | Men | Women | Total | Men | Women | ||
| 2012-13 | 21,869 | 16,552 | 8,250 | 8,302 | 5,317 | 2,280 | 3,037 |
| 2013-14 | 21,138 -731 | 15,814 -738 | 7,926 -324 | 7,888 -414 | 5,324 7 | 2,336 56 | 2,988 -49 |
| 2014-15 | 20,611 -527 | 15,435 -379 | 7,829 -97 | 7,606 -282 | 5,176 -148 | 2,340 4 | 2,836 -152 |
| 2015-16 | 20,130 -481 | 15,027 -408 | 7,637 -192 | 7,390 -216 | 5,103 -73 | 2,385 45 | 2,718 -118 |
| 2016-17 | 19,015 -1,115 | 14,079 -948 | 7,140 -497 | 6,939 -451 | 4,936 -167 | 2,300 -85 | 2,636 -82 |
| 2017-18 | 18,045 -970 | 13,457 -622 | 6,752 -388 | 6,705 -234 | 4,588 -348 | 2,123 -177 | 2,465 -171 |
| 2018-19 | 17,169 -876 | 12,788 -669 | 6,404 -348 | 6,384 -321 | 4,381 -207 | 1,941 -182 | 2,440 -25 |
| 2019-20 | 16,609 -560 | 12,131 -657 | 5,924 -480 | 6,207 -177 | 4,478 97 | 1,914 -27 | 2,564 124 |
| 2020-21 | 16,769 160 | 12,277 146 | 5,800 -124 | 6,477 270 | 4,492 14 | 1,874 -40 | 2,618 54 |
| 2021-22 | 16,234 -535 | 11,834 -443 | 5,575 -225 | 6,259 -218 | 4,400 -92 | 1,797 -77 | 2,603 -15 |
| 2022-23 | 15,649 -585 | 11,429 -405 | 5,405 -170 | 6,024 -235 | 4,220 -180 | 1,730 -67 | 2,490 -113 |
| Average | 18,476 | 13,711 | 6,786 | 6,926 | 4,765 | 2,093 | 2,672 |