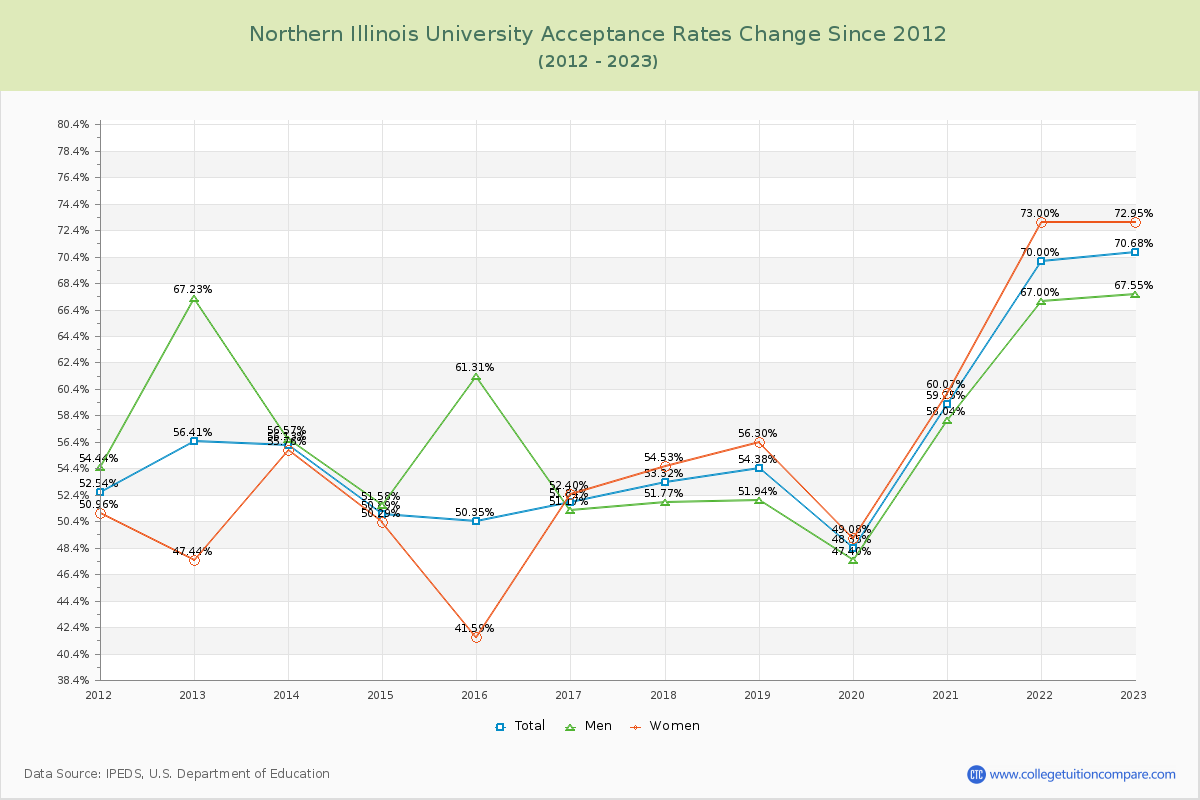
Acceptance Rate Changes
The average acceptance rate over the last 10 years is 56.51%, and this year's acceptance rate is 70.68% at Northern Illinois University. By gender, men students' acceptance rate is 57.41% and women students' rate is 55.76%.
The next table and chart illustrate the acceptance rates changes at Northern Illinois University over the past 11 years (2012-2023).
| Year | Total | Men | Women |
|---|---|---|---|
| 2012-13 | 56.41% | 67.23% | 47.44% |
| 2013-14 | 56.13% -0.28% |
56.57% 8.32% |
55.76% 8.32% |
| 2014-15 | 50.89% -5.24% |
51.58% -5.46% |
50.29% -5.46% |
| 2015-16 | 50.35% -0.53% |
61.31% -8.71% |
41.59% -8.71% |
| 2016-17 | 51.84% 1.49% |
51.17% 10.81% |
52.40% 10.81% |
| 2017-18 | 53.32% 1.47% |
51.77% 2.13% |
54.53% 2.13% |
| 2018-19 | 54.38% 1.06% |
51.94% 1.77% |
56.30% 1.77% |
| 2019-20 | 48.35% -6.02% |
47.40% -7.23% |
49.08% -7.23% |
| 2020-21 | 59.25% 10.89% |
58.04% 11.00% |
60.07% 11.00% |
| 2021-22 | 70.00% 10.75% |
67.00% 12.92% |
73.00% 12.92% |
| 2022-23 | 70.68% 0.68% |
67.55% -0.05% |
72.95% -0.05% |
| Average | 56.51% | 57.41% | 55.76% |