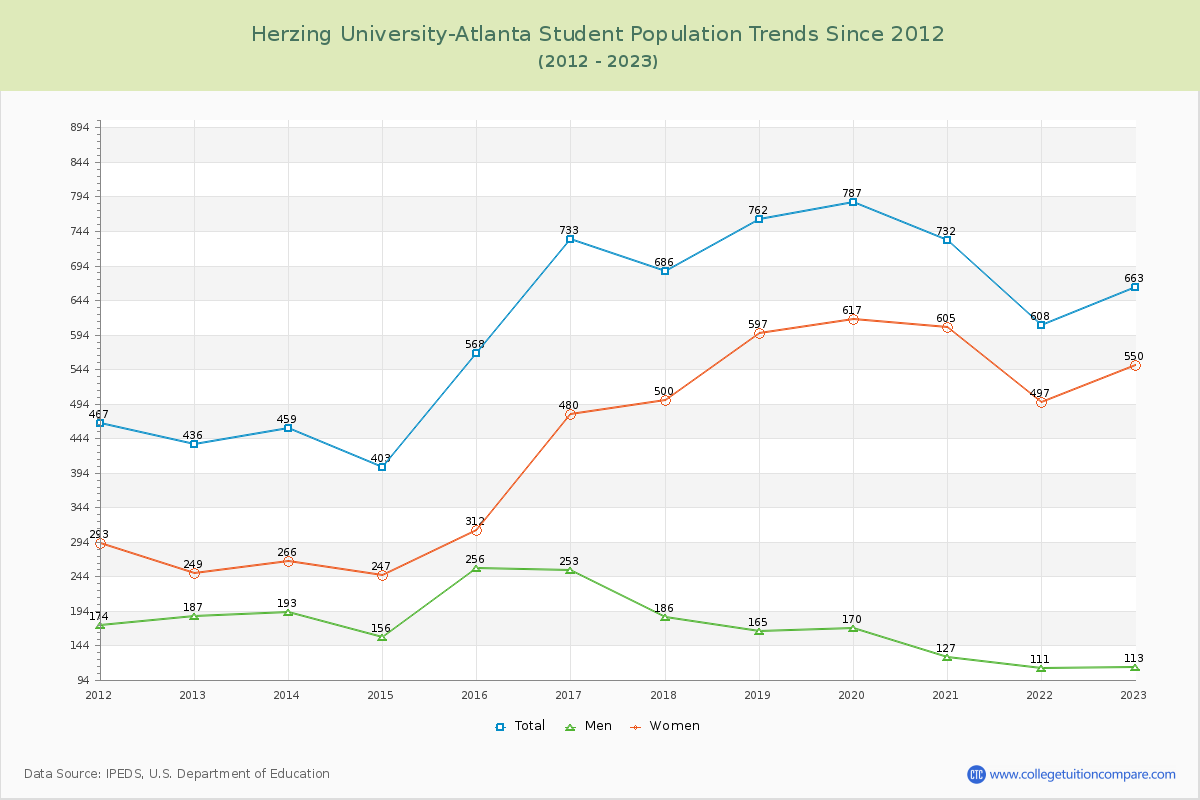
Student Population Changes
The average student population over the last 12 years is 622 where 663 students are attending the school for the academic year 2022-2023.
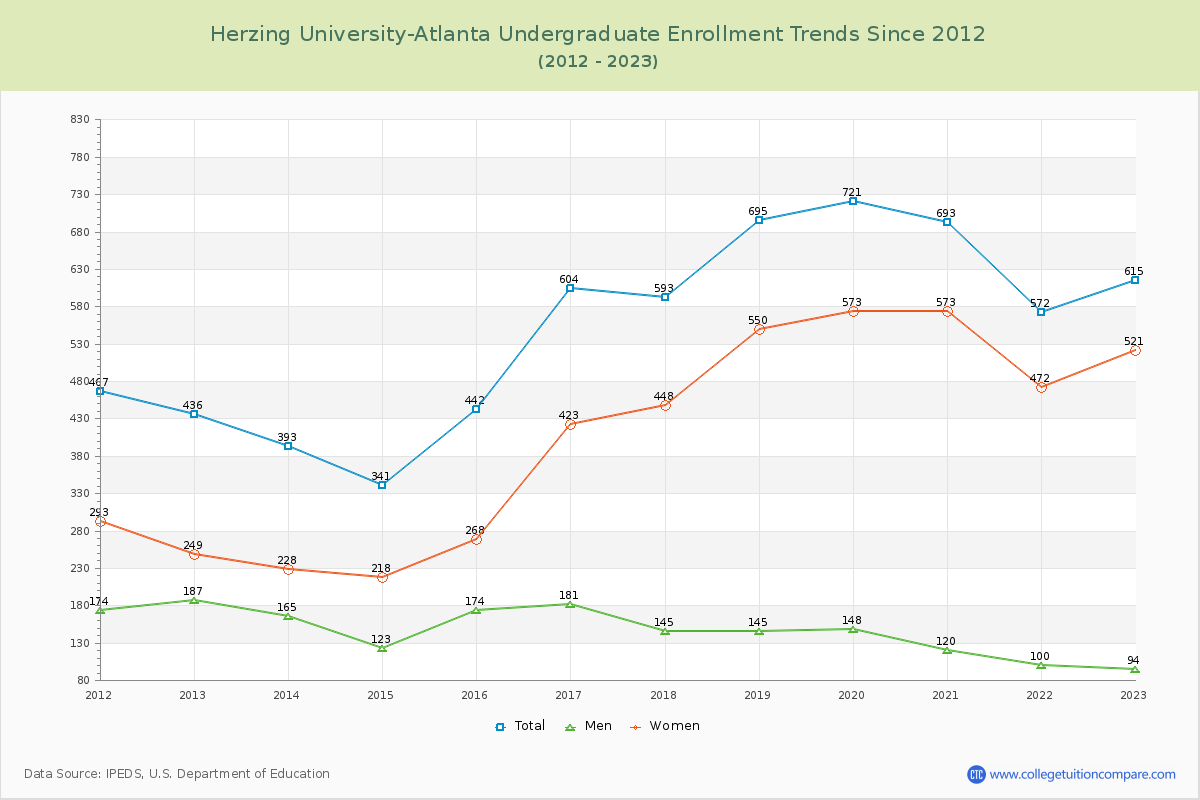
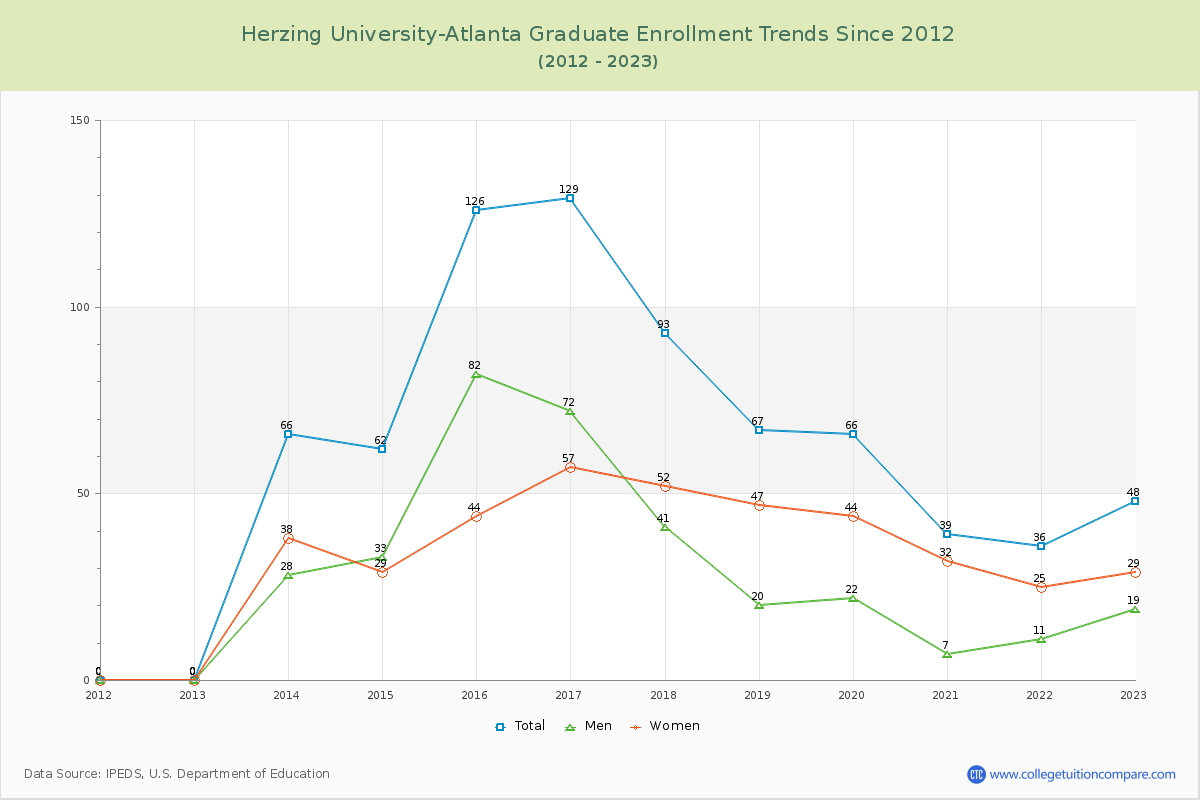
92.76% of total students is undergraduate students and 7.24% students is graduate students. The number of undergraduate students has increased by 179 and the graduate enrollment has increased by 48 over past 10 years.
The female to male ratio is 4.87 to 1 and it means that there are far more female students enrolled in Herzing University-Atlanta than male students.
The following table and chart illustrate the changes in student population by gender at Herzing University-Atlanta since 2012.
| Year | Total | Undergraduate | Graduate | ||||
|---|---|---|---|---|---|---|---|
| Total | Men | Women | Total | Men | Women | ||
| 2012-13 | 436 | 436 | 187 | 249 | 0 | 0 | 0 |
| 2013-14 | 459 23 | 393 -43 | 165 -22 | 228 -21 | 66 66 | 28 28 | 38 38 |
| 2014-15 | 403 -56 | 341 -52 | 123 -42 | 218 -10 | 62 -4 | 33 5 | 29 -9 |
| 2015-16 | 568 165 | 442 101 | 174 51 | 268 50 | 126 64 | 82 49 | 44 15 |
| 2016-17 | 733 165 | 604 162 | 181 7 | 423 155 | 129 3 | 72 -10 | 57 13 |
| 2017-18 | 686 -47 | 593 -11 | 145 -36 | 448 25 | 93 -36 | 41 -31 | 52 -5 |
| 2018-19 | 762 76 | 695 102 | 145 0 | 550 102 | 67 -26 | 20 -21 | 47 -5 |
| 2019-20 | 787 25 | 721 26 | 148 3 | 573 23 | 66 -1 | 22 2 | 44 -3 |
| 2020-21 | 732 -55 | 693 -28 | 120 -28 | 573 0 | 39 -27 | 7 -15 | 32 -12 |
| 2021-22 | 608 -124 | 572 -121 | 100 -20 | 472 -101 | 36 -3 | 11 4 | 25 -7 |
| 2022-23 | 663 55 | 615 43 | 94 -6 | 521 49 | 48 12 | 19 8 | 29 4 |
| Average | 622 | 555 | 144 | 411 | 67 | 30 | 36 |