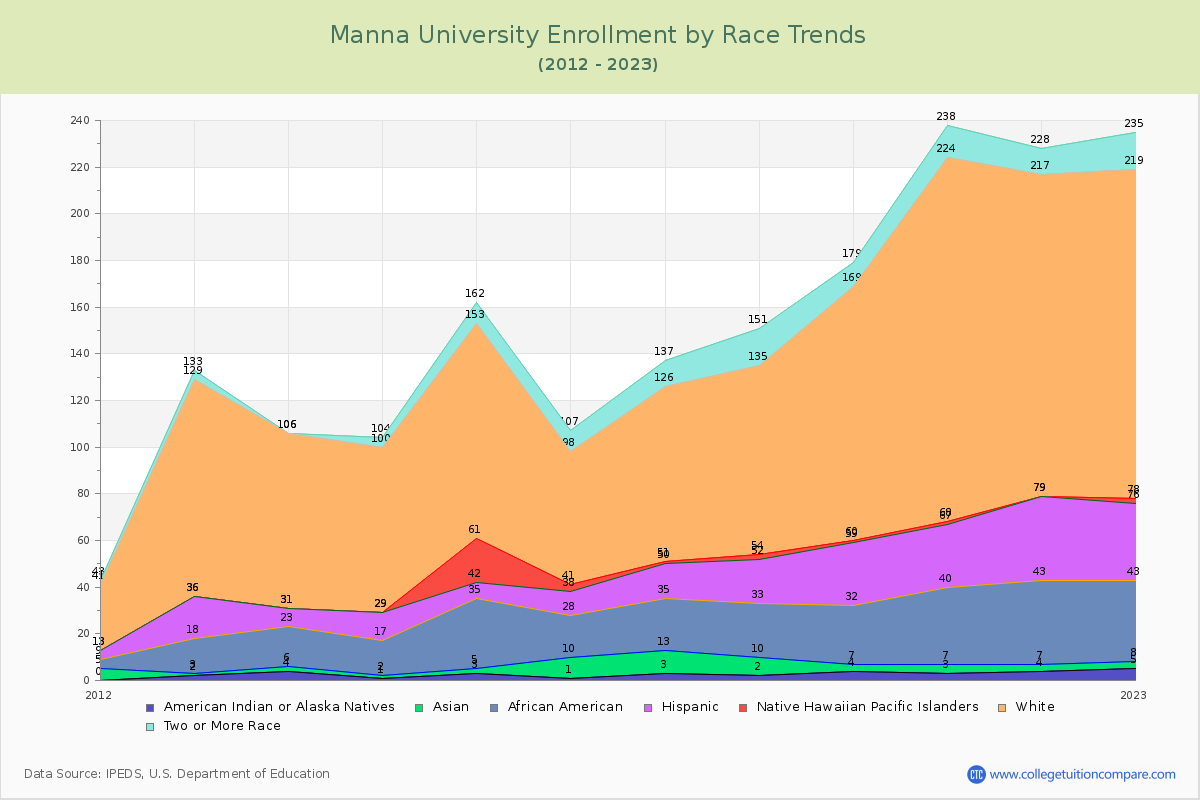
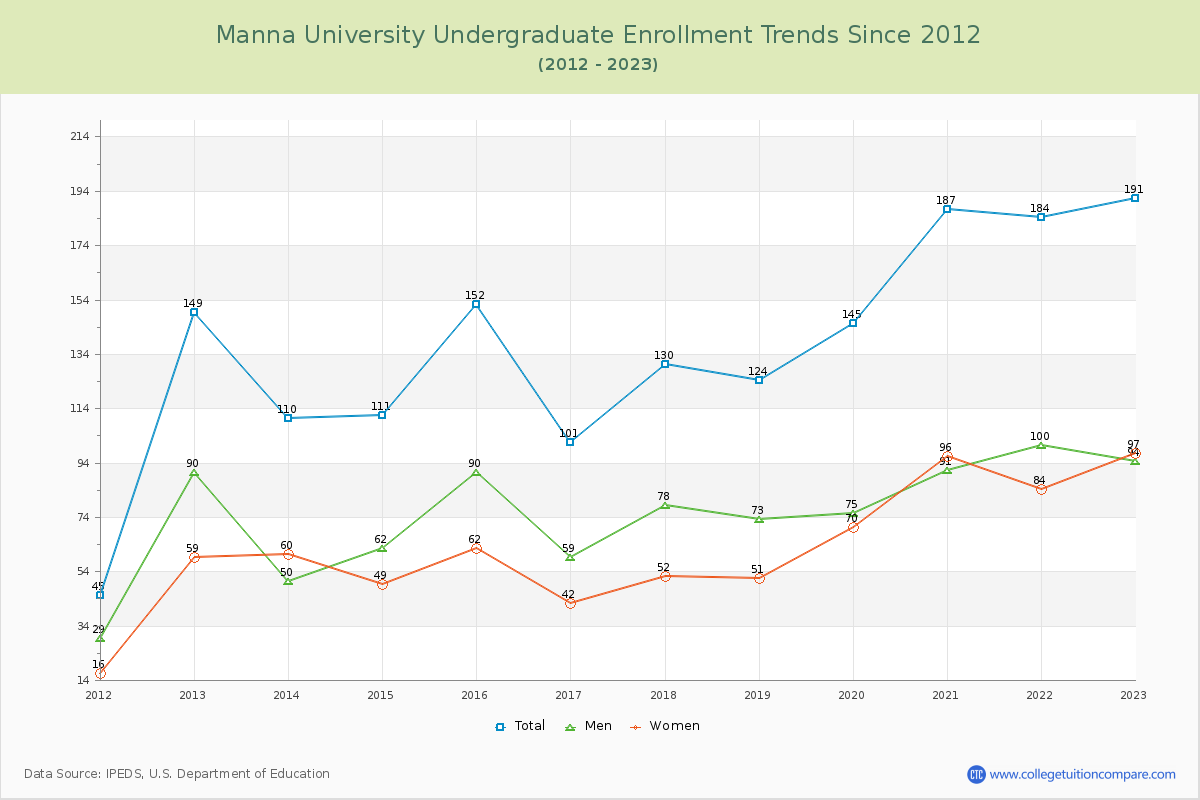
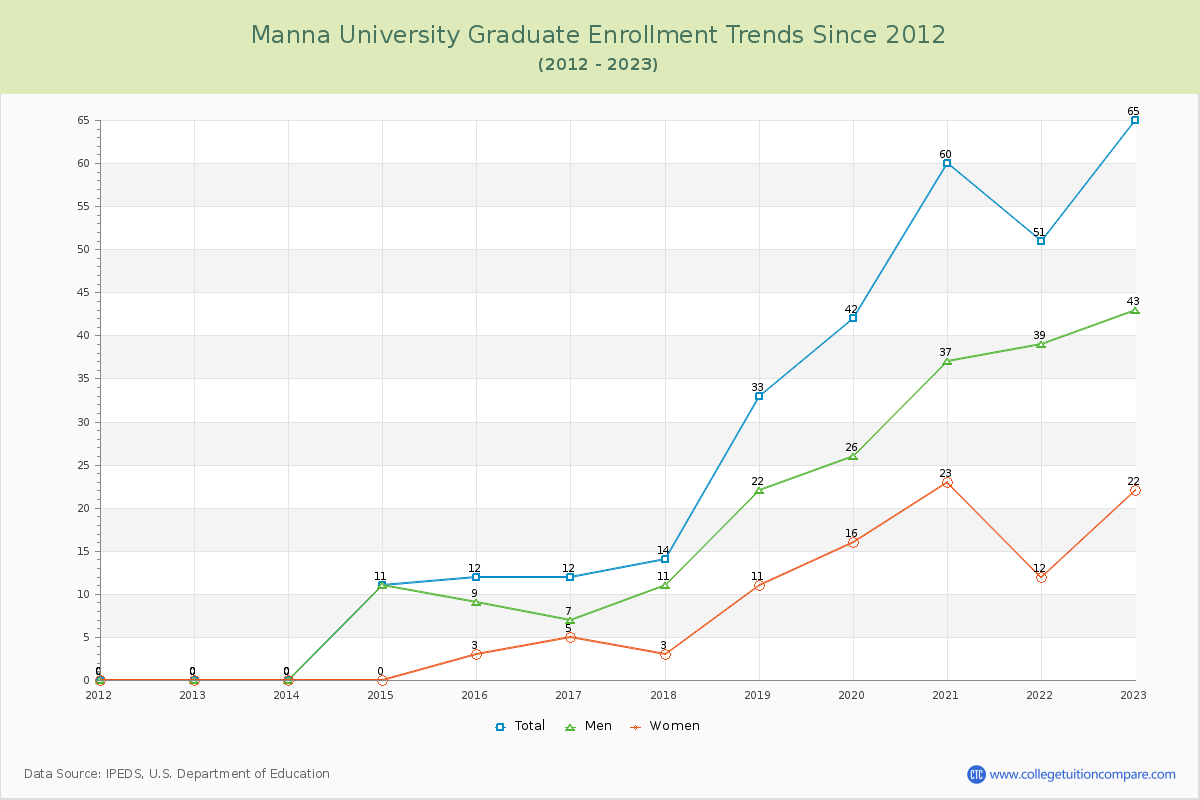
Student Population Changes
The average student population over the last 12 years is 171 where 256 students are attending the school for the academic year 2022-2023.
74.61% of total students is undergraduate students and 25.39% students is graduate students. The number of undergraduate students has increased by 42 and the graduate enrollment has increased by 65 over past 10 years.
The female to male ratio is 0.87 to 1 and it means that there are slightly more male students enrolled in Manna than female students.
The following table and chart illustrate the changes in student population by gender at Manna University since 2012.
| Year | Total | Undergraduate | Graduate | ||||
|---|---|---|---|---|---|---|---|
| Total | Men | Women | Total | Men | Women | ||
| 2012-13 | 149 | 149 | 90 | 59 | 0 | 0 | 0 |
| 2013-14 | 110 -39 | 110 -39 | 50 -40 | 60 1 | 0 0 | 0 0 | 0 0 |
| 2014-15 | 122 12 | 111 1 | 62 12 | 49 -11 | 11 11 | 11 11 | 0 0 |
| 2015-16 | 164 42 | 152 41 | 90 28 | 62 13 | 12 1 | 9 -2 | 3 3 |
| 2016-17 | 113 -51 | 101 -51 | 59 -31 | 42 -20 | 12 0 | 7 -2 | 5 2 |
| 2017-18 | 144 31 | 130 29 | 78 19 | 52 10 | 14 2 | 11 4 | 3 -2 |
| 2018-19 | 157 13 | 124 -6 | 73 -5 | 51 -1 | 33 19 | 22 11 | 11 8 |
| 2019-20 | 187 30 | 145 21 | 75 2 | 70 19 | 42 9 | 26 4 | 16 5 |
| 2020-21 | 247 60 | 187 42 | 91 16 | 96 26 | 60 18 | 37 11 | 23 7 |
| 2021-22 | 235 -12 | 184 -3 | 100 9 | 84 -12 | 51 -9 | 39 2 | 12 -11 |
| 2022-23 | 256 21 | 191 7 | 94 -6 | 97 13 | 65 14 | 43 4 | 22 10 |
| Average | 171 | 144 | 78 | 66 | 27 | 19 | 9 |