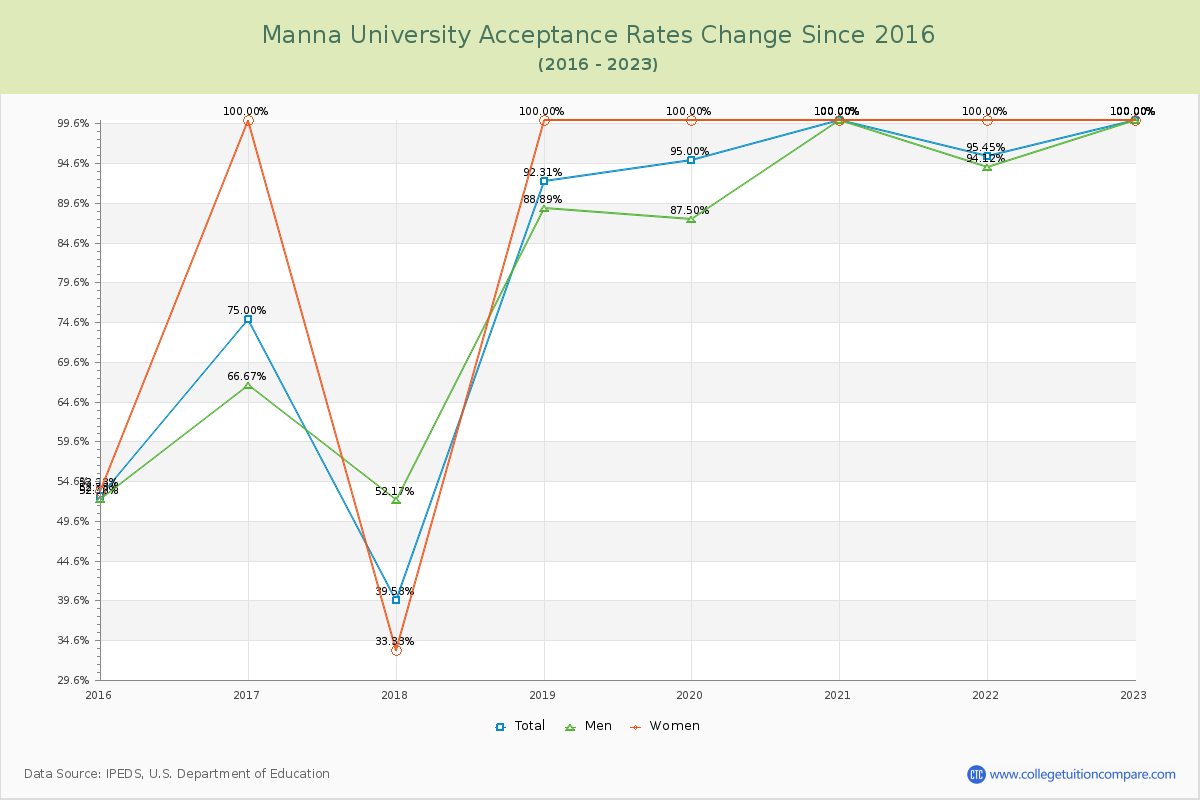
Acceptance Rate Changes
The average acceptance rate over the last 10 years is 81.27%, and this year's acceptance rate is 100.00% at Manna University. By gender, men students' acceptance rate is 80.22% and women students' rate is 85.83%.
The next table and chart illustrate the acceptance rates changes at Manna University over the past 8 years (2015-2023).
| Year | Total | Men | Women |
|---|---|---|---|
| 2015-16 | 52.78% | 52.38% | 53.33% |
| 2016-17 | 75.00% 22.22% |
66.67% 46.67% |
100.00% 46.67% |
| 2017-18 | 39.58% -35.42% |
52.17% -66.67% |
33.33% -66.67% |
| 2018-19 | 92.31% 52.72% |
88.89% 66.67% |
100.00% 66.67% |
| 2019-20 | 95.00% 2.69% |
87.50% 0.00% |
100.00% 0.00% |
| 2020-21 | 100.00% 5.00% |
100.00% 0.00% |
100.00% 0.00% |
| 2021-22 | 95.45% -4.55% |
94.12% 0.00% |
100.00% 0.00% |
| 2022-23 | 100.00% 4.55% |
100.00% 0.00% |
100.00% 0.00% |
| Average | 81.27% | 80.22% | 85.83% |