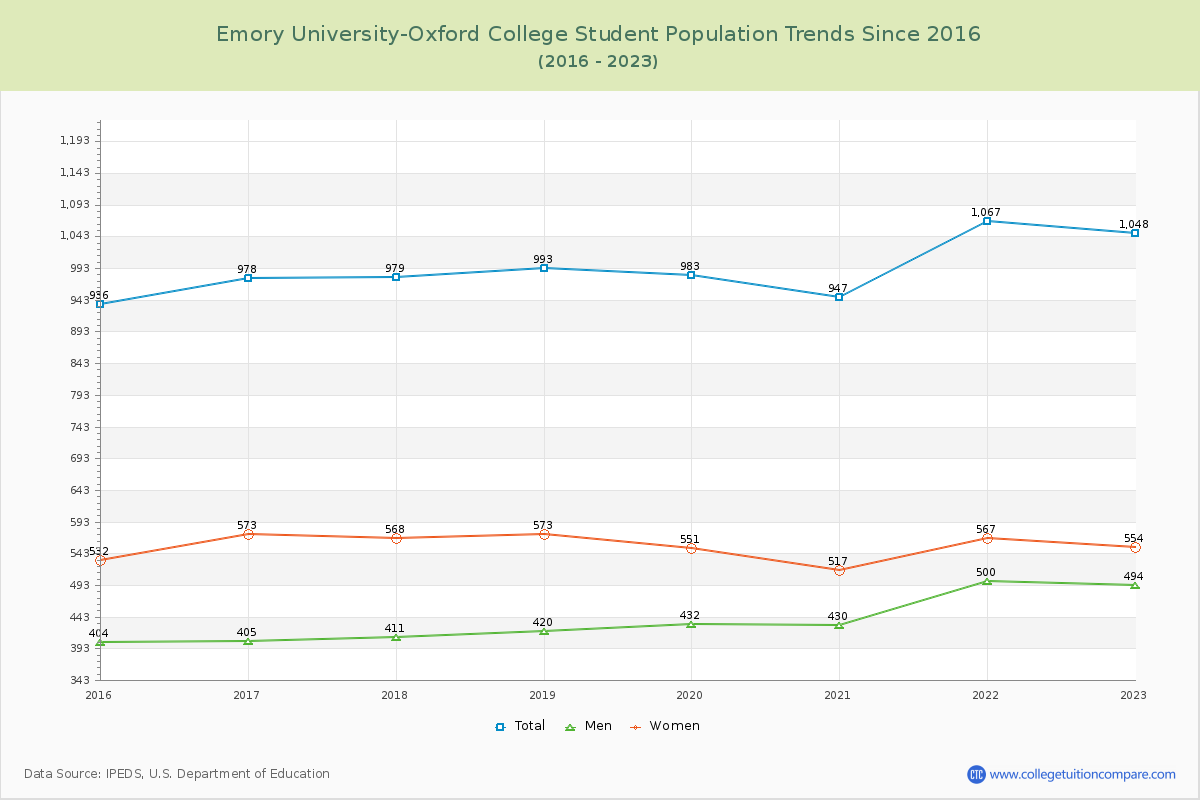
Student Population Changes
The average student population over the last 9 years is 991 where 1,048 students are attending the school for the academic year 2022-2023.
The female to male ratio is 1.12 to 1 and it means that there are slightly more female students enrolled in Emory University-Oxford than male students.
The following table and chart illustrate the changes in student population by gender at Emory University-Oxford College since 2015.
| Year | Total | Men | Women |
|---|---|---|---|
| 2015-16 | 936 | 404 | 532 |
| 2016-17 | 978 42 | 405 1 | 573 41 |
| 2017-18 | 979 1 | 411 6 | 568 -5 |
| 2018-19 | 993 14 | 420 9 | 573 5 |
| 2019-20 | 983 -10 | 432 12 | 551 -22 |
| 2020-21 | 947 -36 | 430 -2 | 517 -34 |
| 2021-22 | 1,067 120 | 500 70 | 567 50 |
| 2022-23 | 1,048 -19 | 494 -6 | 554 -13 |
| Average | 991 | 437 | 554 |