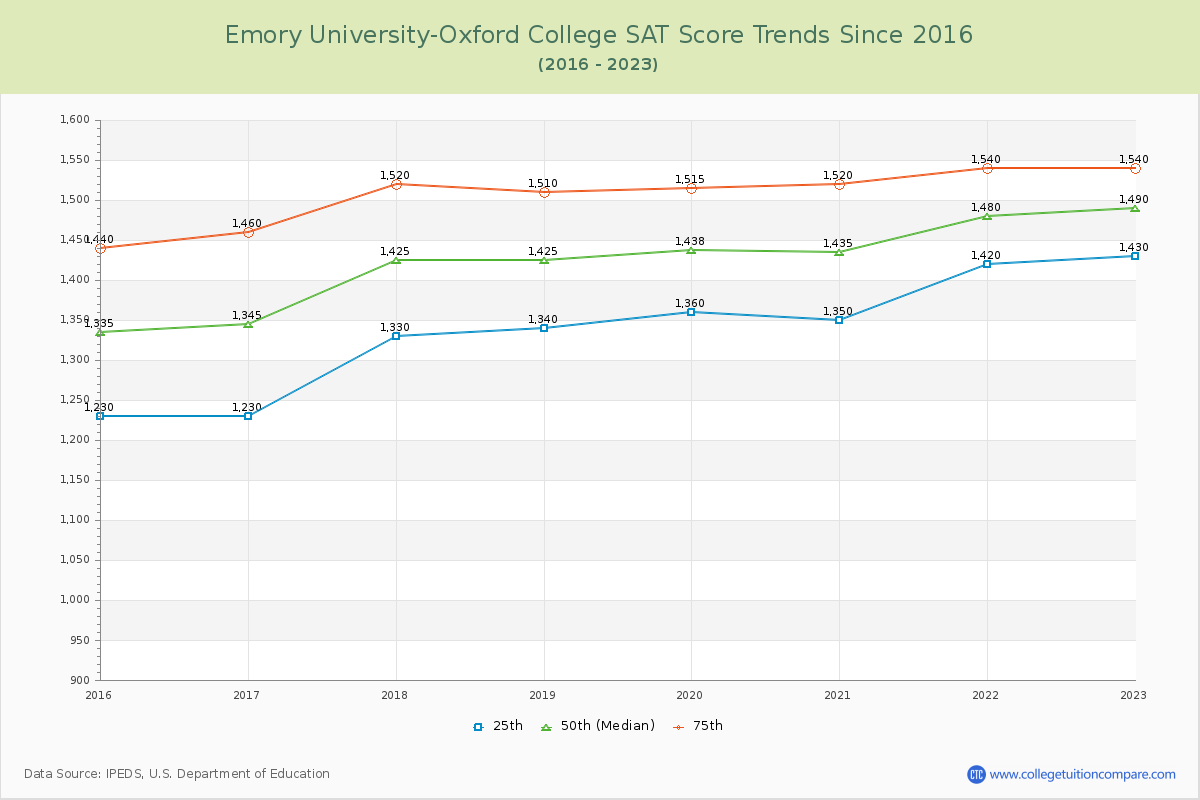
SAT Scores Over Time
The 2023 SAT score is 1490 at Emory University-Oxford. Over the past 9 years, the average SAT score is 1336 (25th percentile) and 1506 (75th percentile). Compared to similar schools, the submitted SAT scores are extremely competitive and high at Emory University-Oxford.
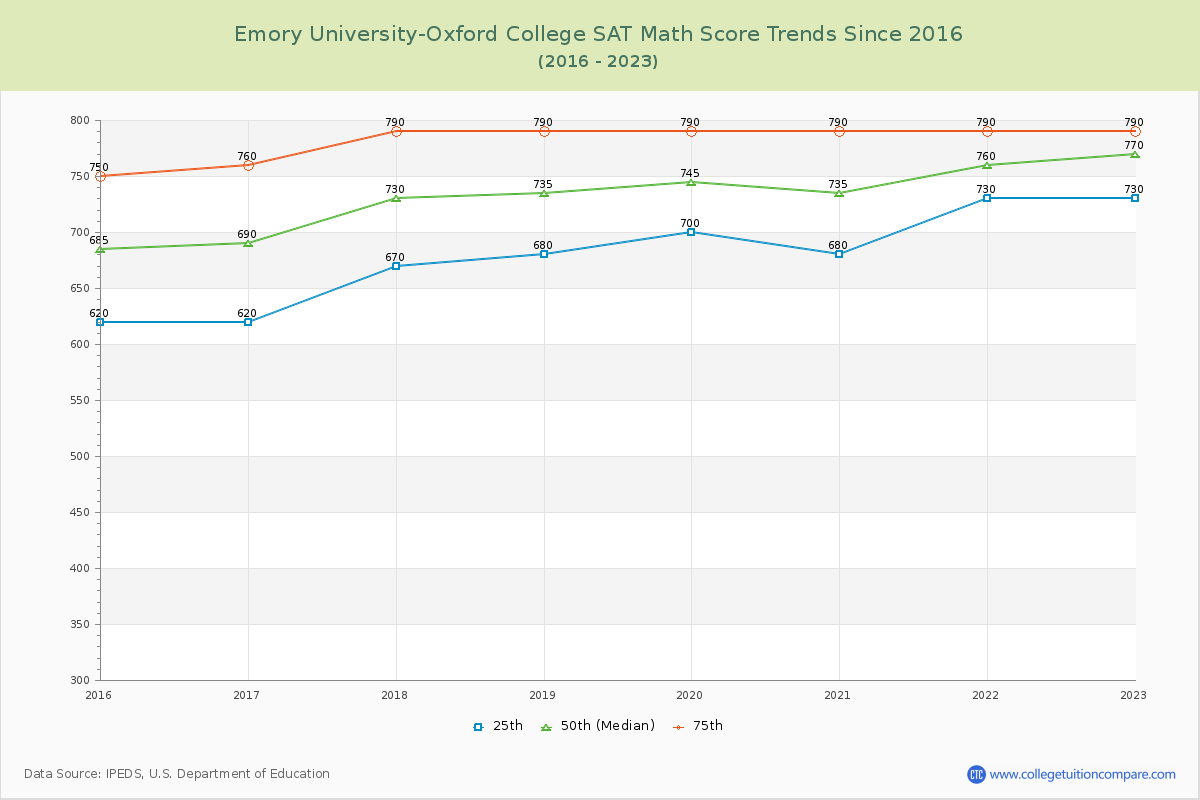
The following table and chart illustrate the changes in SAT scores at Emory University-Oxford College since 2015.
| Year | Total | Math | Evidence-Based Reading and Writing | ||||||
|---|---|---|---|---|---|---|---|---|---|
| 25th | 50th | 75th | 25th | 50th | 75th | 25th | 50th | 75th | |
| 2015-16 | 1,230 | 1,335 | 1,440 | 620 | 685 | 750 | 610 | 650 | 690 |
| 2016-17 | 1,230 | 1,345 | 1,460 | 620 | 690 | 760 | 610 | 655 | 700 |
| 2017-18 | 1,330 | 1,425 | 1,520 | 670 | 730 | 790 | 660 | 695 | 730 |
| 2018-19 | 1,340 | 1,425 | 1,510 | 680 | 735 | 790 | 660 | 690 | 720 |
| 2019-20 | 1,360 | 1,438 | 1,515 | 700 | 745 | 790 | 660 | 693 | 725 |
| 2020-21 | 1,350 | 1,435 | 1,520 | 680 | 735 | 790 | 670 | 700 | 730 |
| 2021-22 | 1,420 | 1,480 | 1,540 | 730 | 760 | 790 | 690 | 720 | 750 |
| 2022-23 | 1,430 | 1,490 | 1,540 | 730 | 770 | 790 | 700 | 720 | 750 |
| Average | 1336 | 1422 | 1506 | 679 | 731 | 781 | 658 | 690 | 724 |
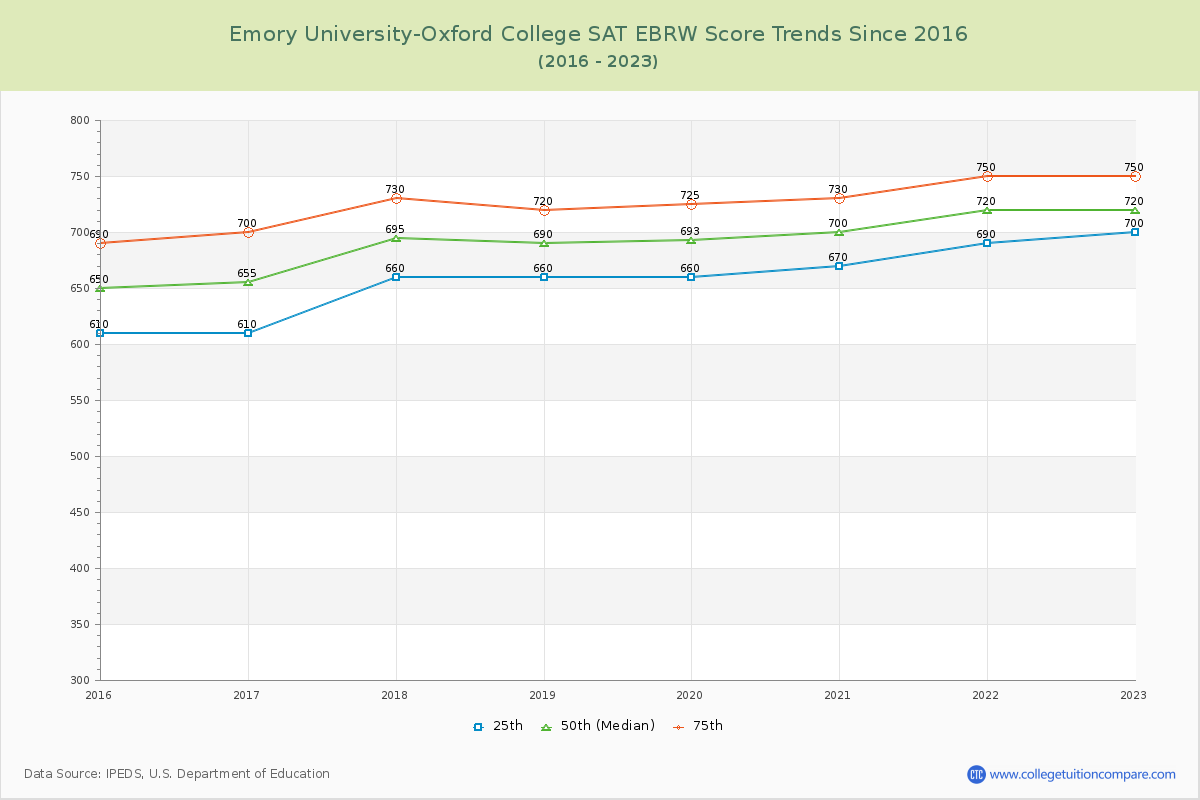
*SAT Evidence-Based Reading and Writing replaces SAT critical reading and writing since year 2017.
**The SAT Writing score is excluded from the total scores for year from 2011 to 2016.