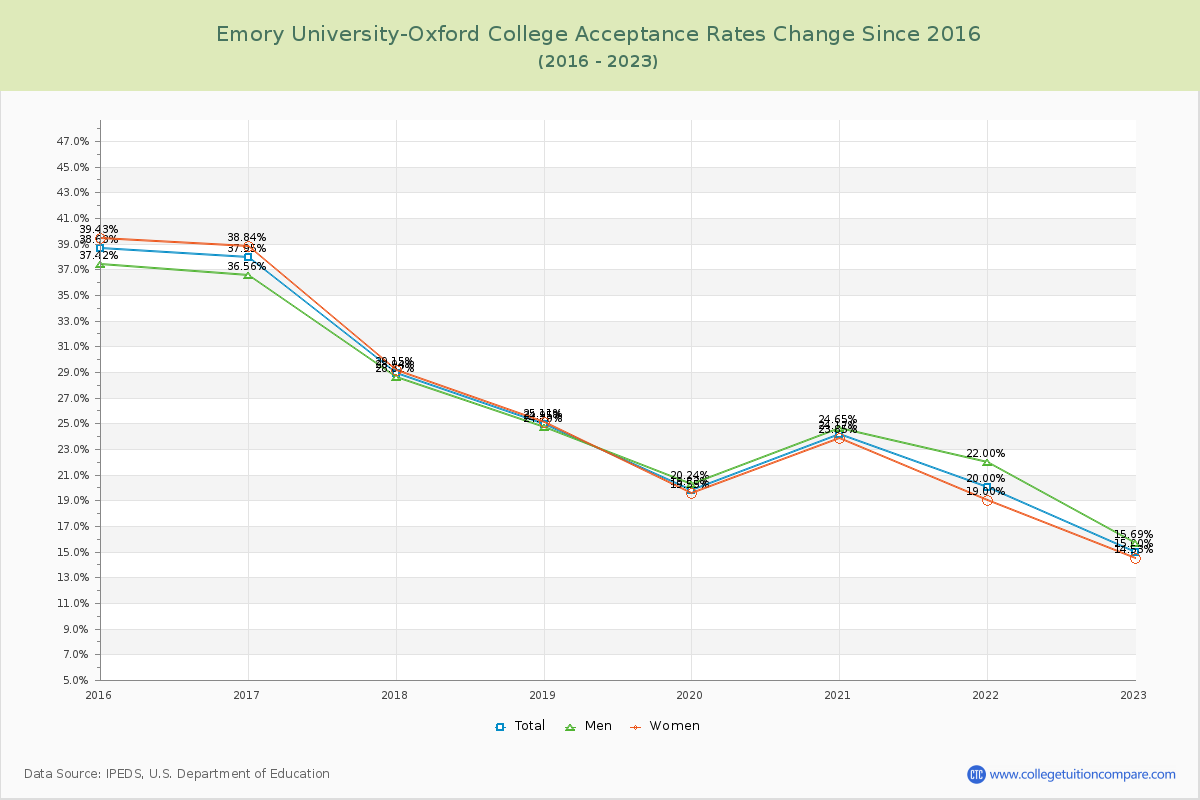
Acceptance Rate Changes
The average acceptance rate over the last 10 years is 26.18%, and this year's acceptance rate is 15.00% at Emory University-Oxford College. By gender, men students' acceptance rate is 26.24% and women students' rate is 26.18%. For 2023 admission, it was slightly harder to get into Emory University-Oxford College than the previous year.
The next table and chart illustrate the acceptance rates changes at Emory University-Oxford College over the past 8 years (2015-2023).
| Year | Total | Men | Women |
|---|---|---|---|
| 2015-16 | 38.63% | 37.42% | 39.43% |
| 2016-17 | 37.95% -0.68% |
36.56% -0.58% |
38.84% -0.58% |
| 2017-18 | 28.94% -9.01% |
28.62% -9.69% |
29.15% -9.69% |
| 2018-19 | 24.95% -3.99% |
24.70% -4.04% |
25.11% -4.04% |
| 2019-20 | 19.83% -5.12% |
20.24% -5.56% |
19.55% -5.56% |
| 2020-21 | 24.17% 4.35% |
24.65% 4.30% |
23.85% 4.30% |
| 2021-22 | 20.00% -4.18% |
22.00% -4.84% |
19.00% -4.84% |
| 2022-23 | 15.00% -5.00% |
15.69% -4.48% |
14.53% -4.48% |
| Average | 26.18% | 26.24% | 26.18% |