Student Population by Gender
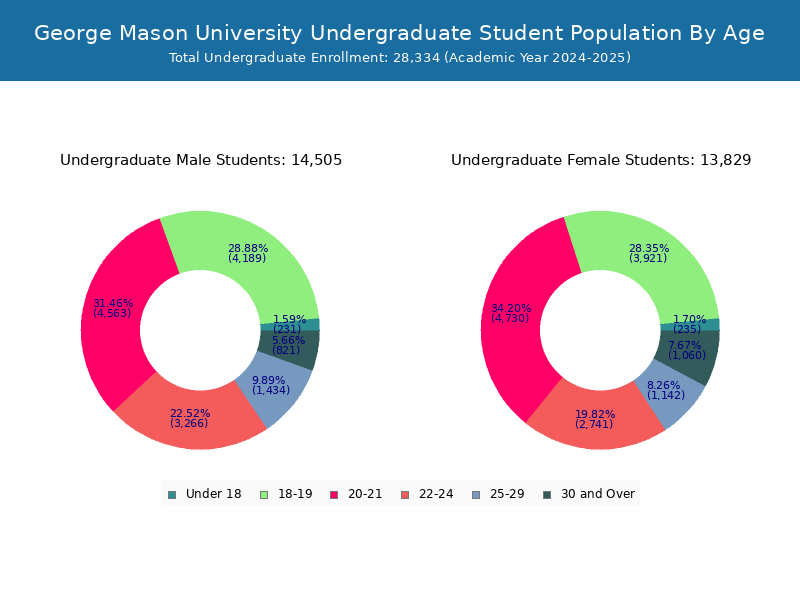
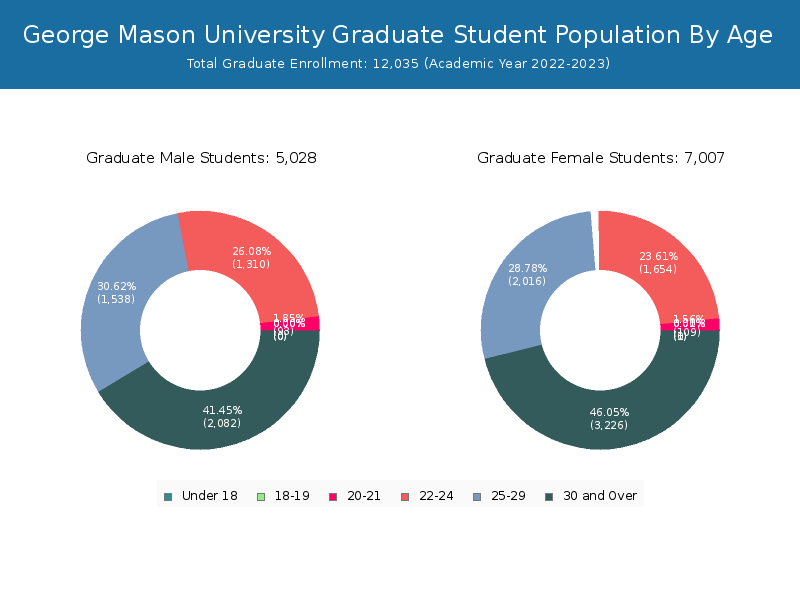
George Mason University has a total of 39,049 enrolled students for the academic year 2022-2023. 27,014 students have enrolled in undergraduate programs and 12,035 students joined graduate programs.
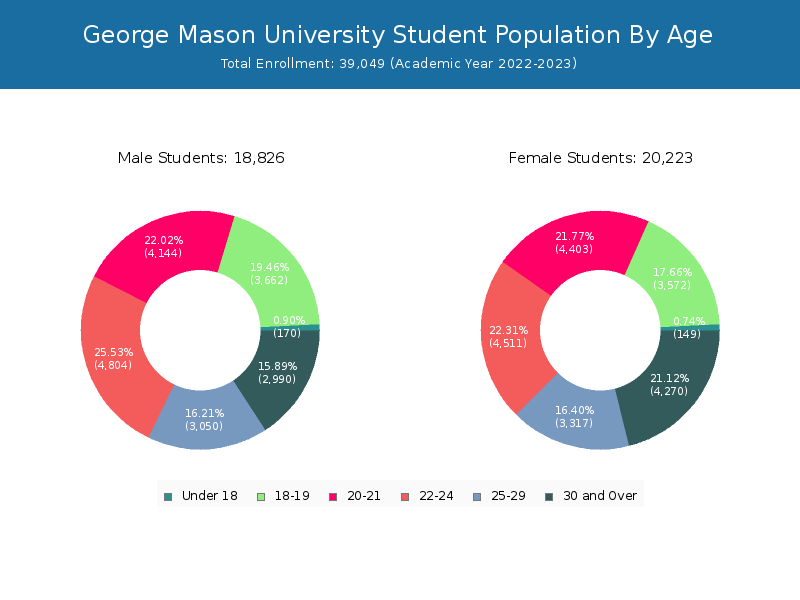
By gender, 18,826 male and 20,223 female students (the male-female ratio is 48:52) are attending the school. The gender distribution is based on the 2022-2023 data.
| Total | Undergraduate | Graduate | |
|---|---|---|---|
| Total | 39,049 | 27,014 | 12,035 |
| Men | 18,826 | 13,798 | 5,028 |
| Women | 20,223 | 13,216 | 7,007 |
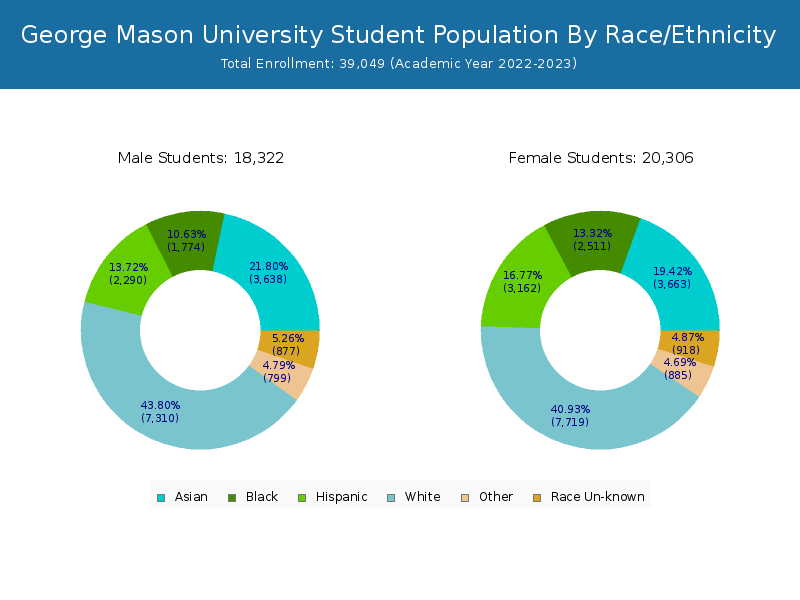
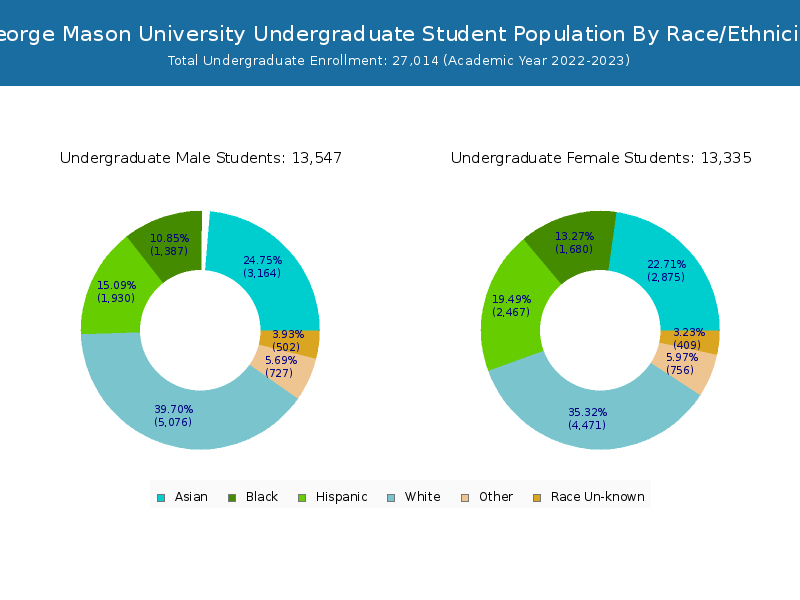
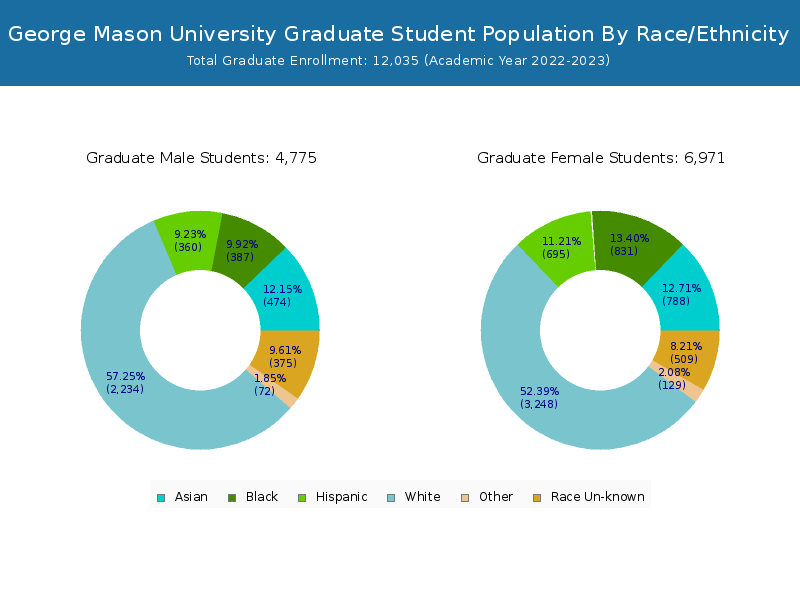
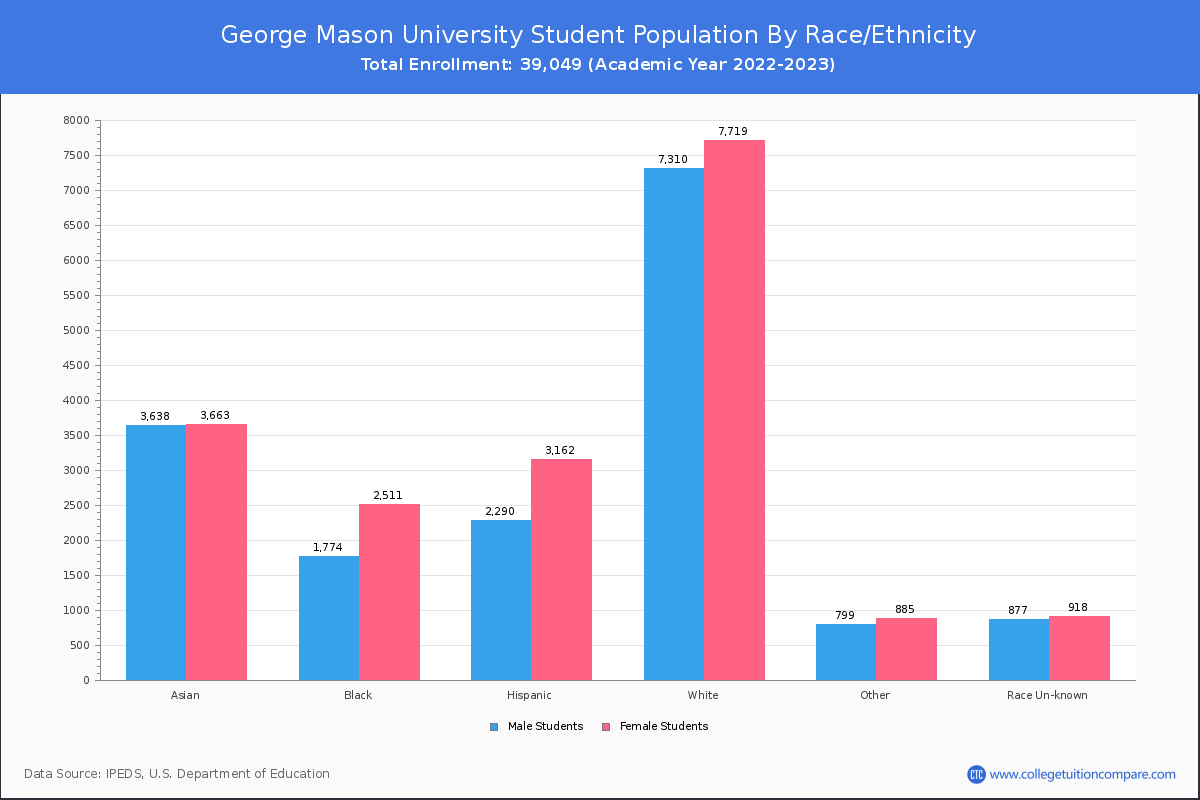
Student Distribution by Race/Ethnicity
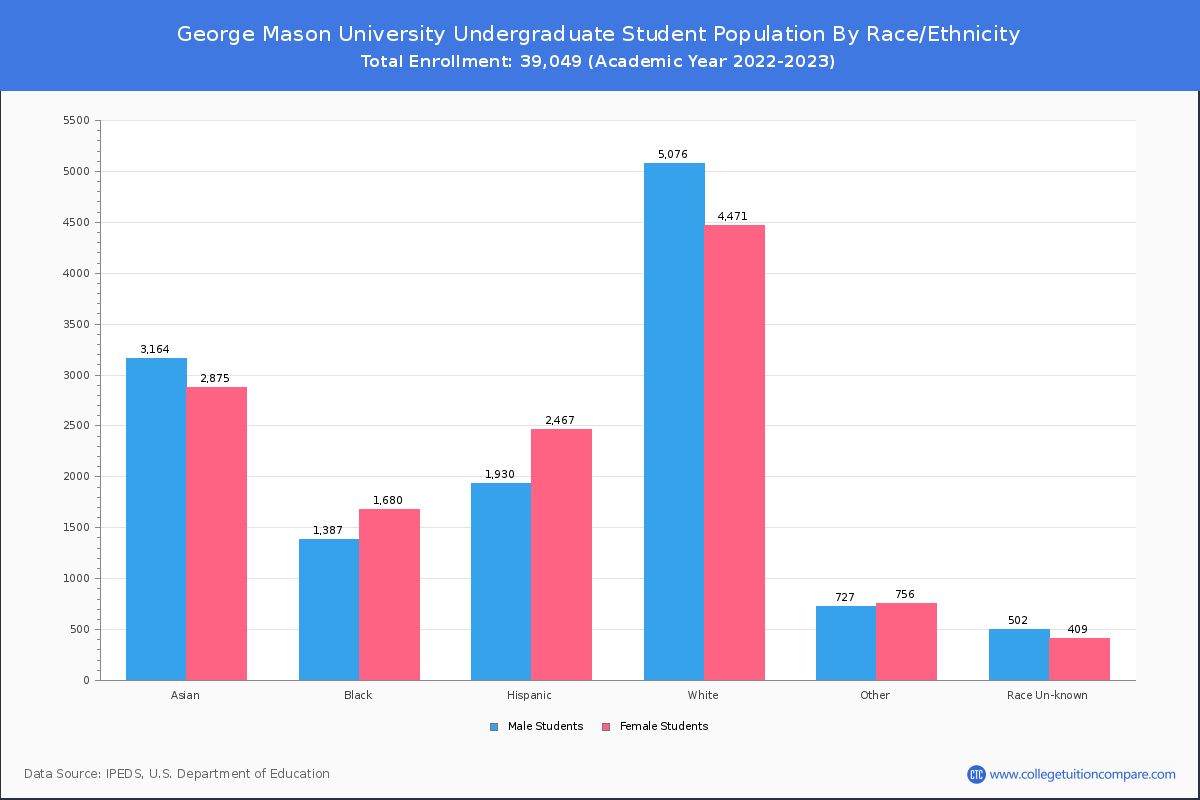
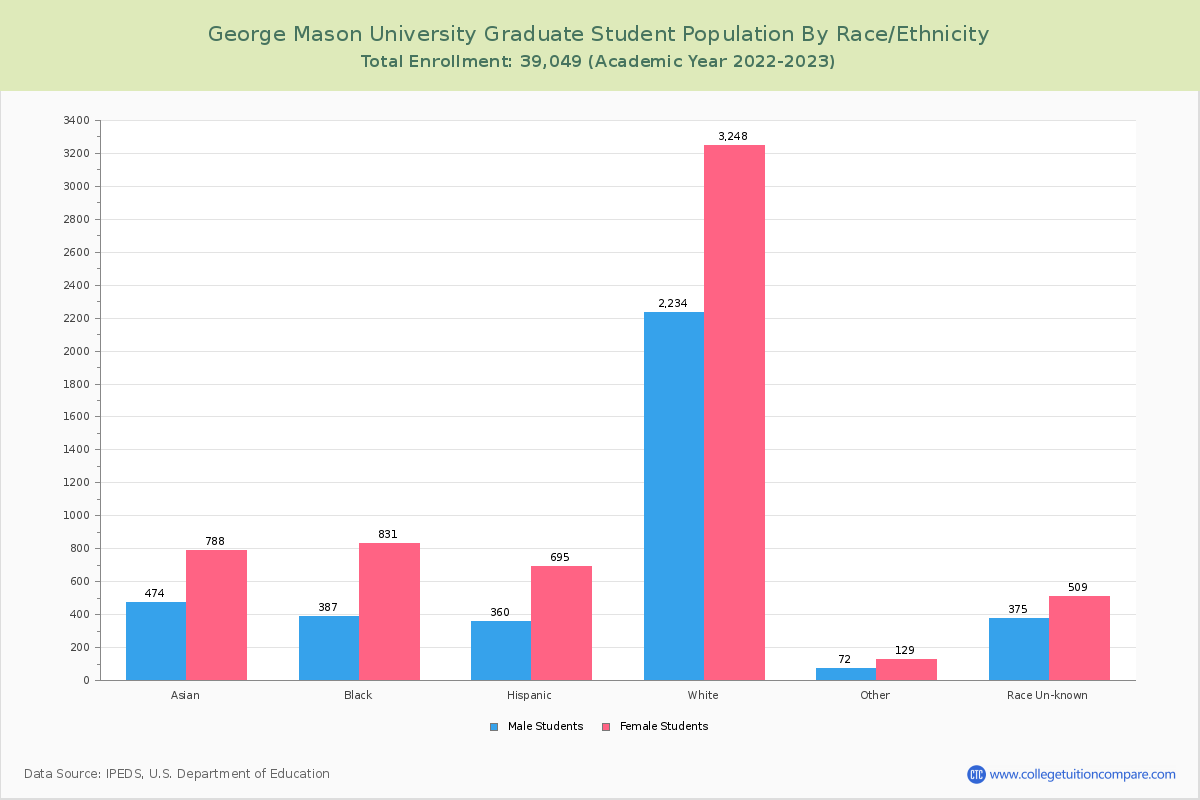
By race/ethnicity, 14,374 White, 4,445 Black, and 7,438 Asian students out of a total of 39,049 are attending at George Mason University. Comprehensive enrollment statistic data by race/ethnicity is shown in the next chart (Academic year 2022-2023 data).
| Race | Total | Men | Women |
|---|---|---|---|
| American Indian or Native American | 49 | 25 | 24 |
| Asian | 7,438 | 3,783 | 3,655 |
| Black | 4,445 | 1,939 | 2,506 |
| Hispanic | 5,607 | 2,432 | 3,175 |
| Native Hawaiian or Other Pacific Islanders | 41 | 17 | 24 |
| White | 14,374 | 6,908 | 7,466 |
| Two or more races | 1,567 | 756 | 811 |
| Race Unknown | 1,611 | 809 | 802 |
| Race | Total | Men | Women |
|---|---|---|---|
| American Indian or Native American | 26 | 16 | 10 |
| Asian | 6,193 | 3,314 | 2,879 |
| Black | 3,215 | 1,520 | 1,695 |
| Hispanic | 4,572 | 2,070 | 2,502 |
| Native Hawaiian or Other Pacific Islanders | 29 | 14 | 15 |
| White | 9,217 | 4,871 | 4,346 |
| Two or more races | 1,427 | 698 | 729 |
| Race Unknown | 867 | 481 | 386 |
| Race | Total | Men | Women |
|---|---|---|---|
| American Indian or Native American | 4 | 2 | 2 |
| Asian | 481 | 250 | 231 |
| Black | 331 | 156 | 175 |
| Hispanic | 607 | 273 | 334 |
| Native Hawaiian or Other Pacific Islanders | 8 | 3 | 5 |
| White | 855 | 457 | 398 |
| Two or more races | 144 | 60 | 84 |
| Race Unknown | 90 | 50 | 40 |
Student Age Distribution
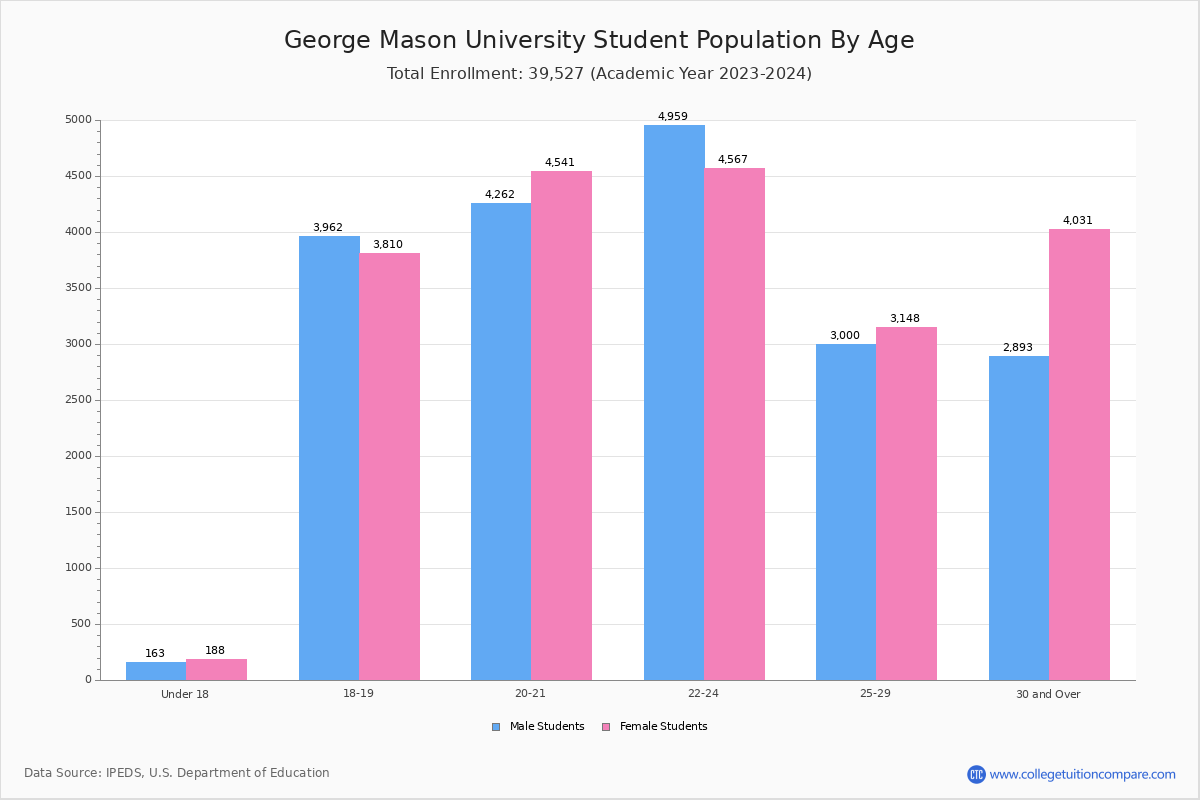
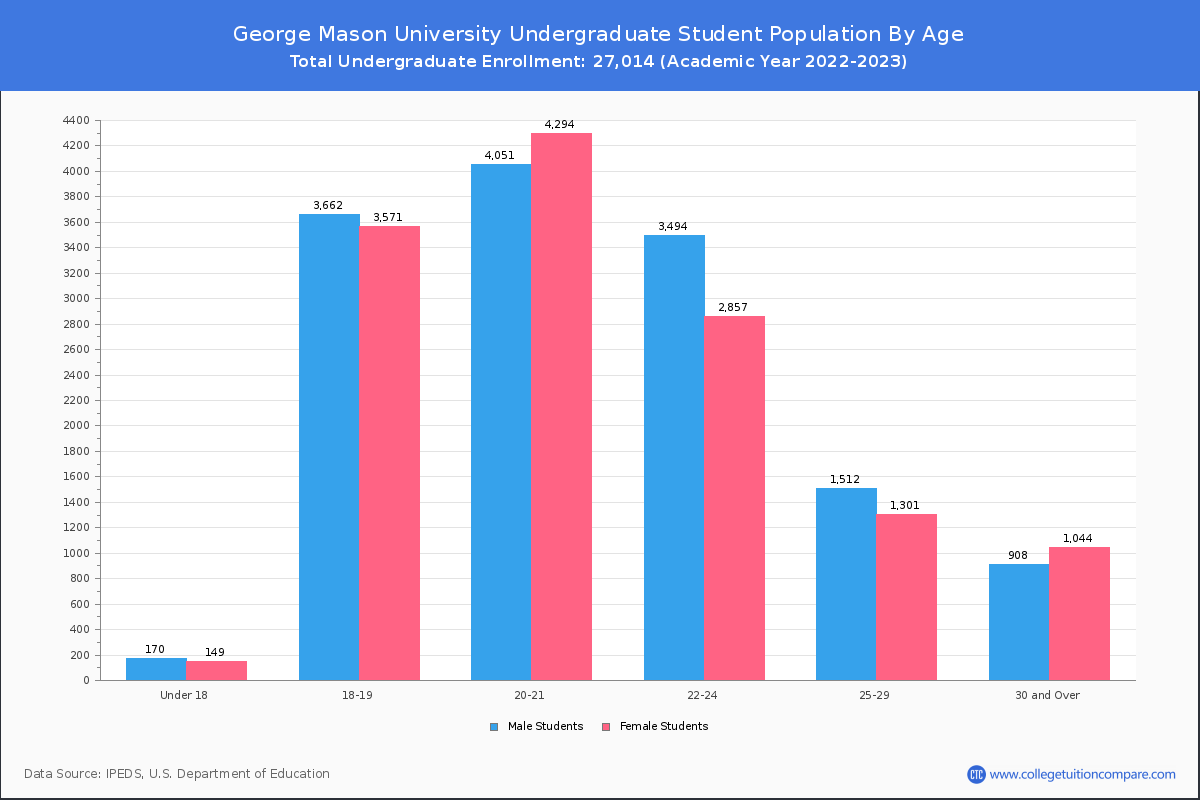
By age, GMU has 319 students under 18 years old and 90 students over 65 years old. There are 25,415 students under 25 years old, and 13,627 students over 25 years old out of 39,049 total students.
In undergraduate programs, 319 students are younger than 18 and 31 students are older than 65. GMU has 22,248 undergraduate students aged under 25 and 4,765 students aged 25 and over.
It has 3,167 graduate students aged under 25 and 8,862 students aged 25 and over.
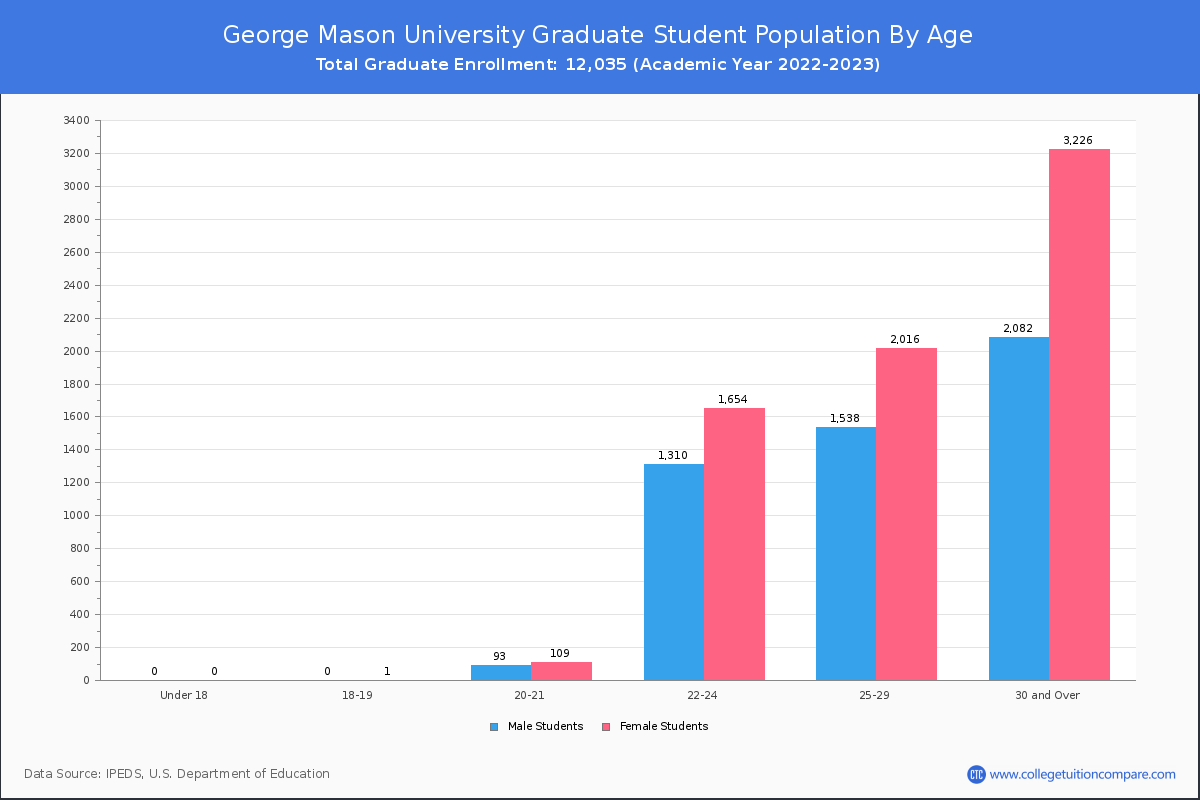
| Age | Total | Men | Women |
|---|---|---|---|
| Under 18 | 319 | 149 | 170 |
| 18-19 | 7,234 | 3,572 | 3,662 |
| 20-21 | 8,547 | 4,403 | 4,144 |
| 22-24 | 9,315 | 4,511 | 4,804 |
| 25-29 | 6,367 | 3,317 | 3,050 |
| 30-34 | 2,825 | 1,558 | 1,267 |
| 35-39 | 1,567 | 908 | 659 |
| 40-49 | 1,807 | 1,155 | 652 |
| 50-64 | 971 | 603 | 368 |
| Over 65 | 90 | 46 | 44 |
| Age | Total | Men | Women |
|---|---|---|---|
| Under 18 | 319 | 149 | 170 |
| 18-19 | 7,233 | 3,571 | 3,662 |
| 20-21 | 8,345 | 4,294 | 4,051 |
| 22-24 | 6,351 | 2,857 | 3,494 |
| 25-29 | 2,813 | 1,301 | 1,512 |
| 30-34 | 924 | 459 | 465 |
| 35-39 | 387 | 190 | 197 |
| 40-49 | 422 | 254 | 168 |
| 50-64 | 188 | 122 | 66 |
| Over 65 | 31 | 19 | 12 |
| Age | Total | Men | Women |
|---|
Online Student Enrollment
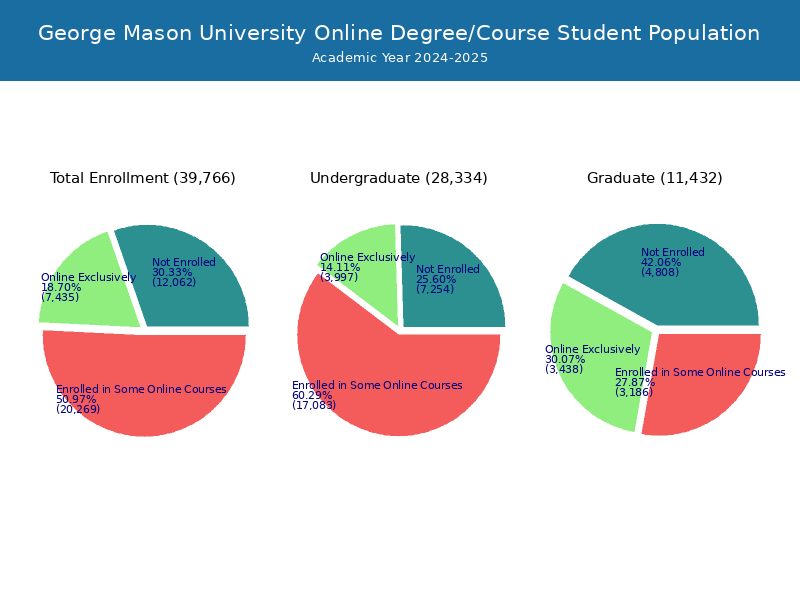
Distance learning, also called online education, is very attractive to students, especially who want to continue education and work in field. At George Mason University, 7,421 students are enrolled exclusively in online courses and 20,436 students are enrolled in some online courses.
395 students lived in Virginia or jurisdiction in which the school is located are enrolled exclusively in online courses and 7,026 students live in other State or outside of the United States.
| All Students | Enrolled Exclusively Online Courses | Enrolled in Some Online Courses | |
|---|---|---|---|
| All Students | 39,049 | 7,421 | 20,436 |
| Undergraduate | 27,014 | 3,832 | 17,144 |
| Graduate | 12,035 | 3,589 | 3,292 |
| Virginia Residents | Other States in U.S. | Outside of U.S. | |
|---|---|---|---|
| All Students | 395 | 7,018 | 8 |
| Undergraduate | 36 | 3,793 | 3 |
| Graduate | 359 | 3,225 | 5 |
Transfer-in Students (Undergraduate)
Among 27,014 enrolled in undergraduate programs, 2,636 students have transferred-in from other institutions. The percentage of transfer-in students is 9.76%.2,057 students have transferred in as full-time status and 579 students transferred in as part-time status.
| Number of Students | |
|---|---|
| Regular Full-time | 19,455 |
| Transfer-in Full-time | 2,057 |
| Regular Part-time | 4,923 |
| Transfer-in Part-time | 579 |