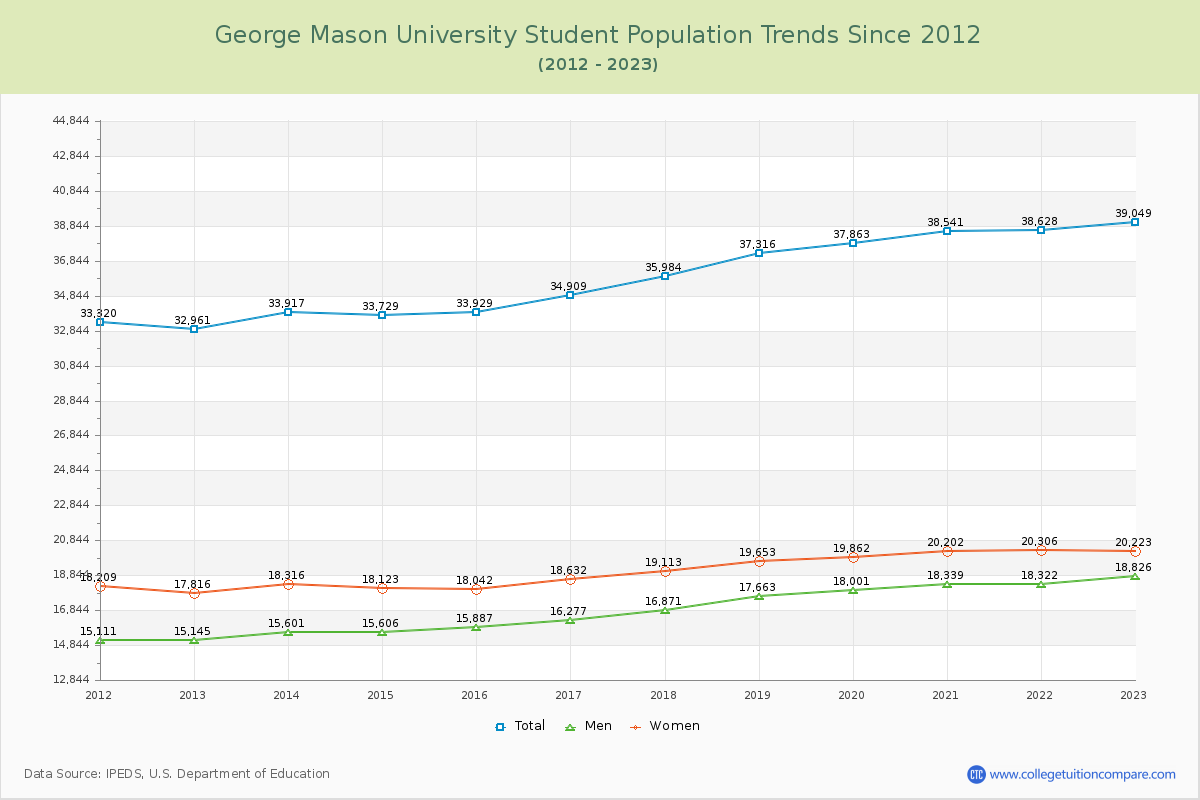
Student Population Changes
The average student population over the last 12 years is 36,075 where 39,049 students are attending the school for the academic year 2022-2023.
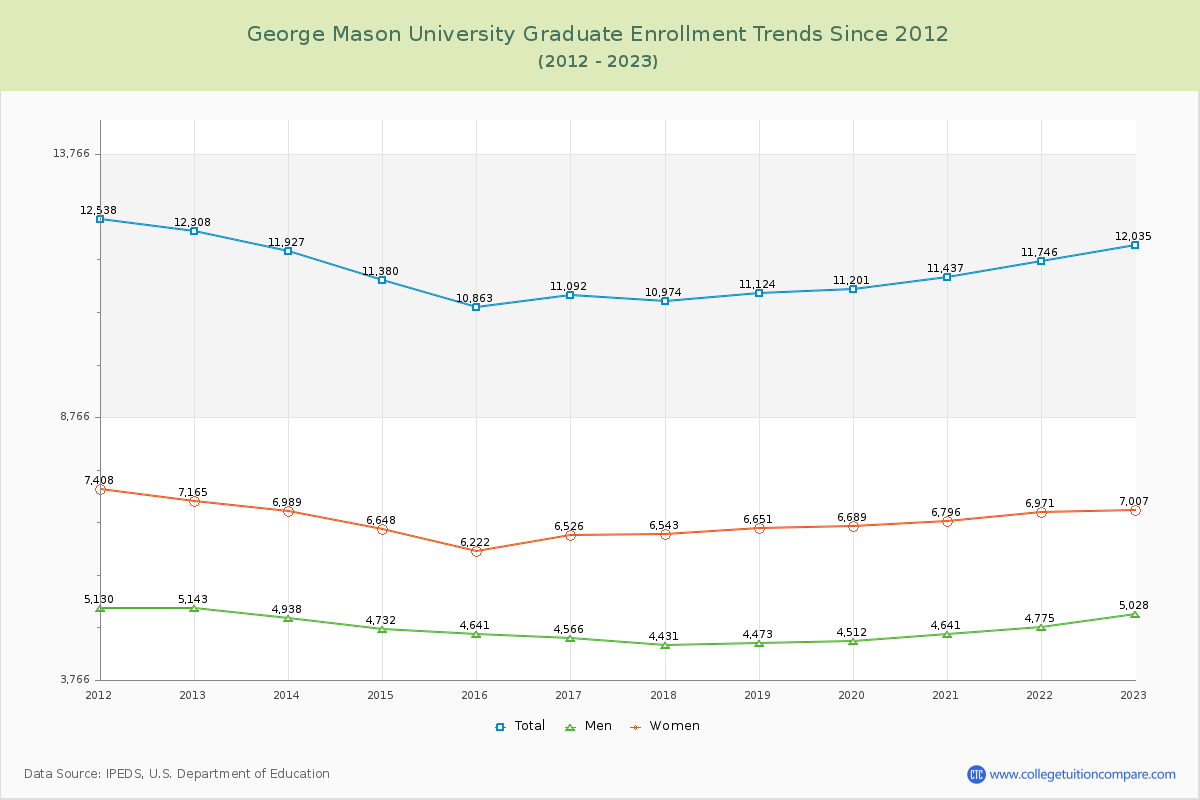
69.18% of total students is undergraduate students and 30.82% students is graduate students. The number of undergraduate students has increased by 6,361 and the graduate enrollment has decreased by 273 over past 10 years.
The female to male ratio is 1.07 to 1 and it means that there are similar numbers of female and male students enrolled in GMU.
The following table and chart illustrate the changes in student population by gender at George Mason University since 2012.
| Year | Total | Undergraduate | Graduate | ||||
|---|---|---|---|---|---|---|---|
| Total | Men | Women | Total | Men | Women | ||
| 2012-13 | 32,961 | 20,653 | 10,002 | 10,651 | 12,308 | 5,143 | 7,165 |
| 2013-14 | 33,917 956 | 21,990 1,337 | 10,663 661 | 11,327 676 | 11,927 -381 | 4,938 -205 | 6,989 -176 |
| 2014-15 | 33,729 -188 | 22,349 359 | 10,874 211 | 11,475 148 | 11,380 -547 | 4,732 -206 | 6,648 -341 |
| 2015-16 | 33,929 200 | 23,066 717 | 11,246 372 | 11,820 345 | 10,863 -517 | 4,641 -91 | 6,222 -426 |
| 2016-17 | 34,909 980 | 23,817 751 | 11,711 465 | 12,106 286 | 11,092 229 | 4,566 -75 | 6,526 304 |
| 2017-18 | 35,984 1,075 | 25,010 1,193 | 12,440 729 | 12,570 464 | 10,974 -118 | 4,431 -135 | 6,543 17 |
| 2018-19 | 37,316 1,332 | 26,192 1,182 | 13,190 750 | 13,002 432 | 11,124 150 | 4,473 42 | 6,651 108 |
| 2019-20 | 37,863 547 | 26,662 470 | 13,489 299 | 13,173 171 | 11,201 77 | 4,512 39 | 6,689 38 |
| 2020-21 | 38,541 678 | 27,104 442 | 13,698 209 | 13,406 233 | 11,437 236 | 4,641 129 | 6,796 107 |
| 2021-22 | 38,628 87 | 26,882 -222 | 13,547 -151 | 13,335 -71 | 11,746 309 | 4,775 134 | 6,971 175 |
| 2022-23 | 39,049 421 | 27,014 132 | 13,798 251 | 13,216 -119 | 12,035 289 | 5,028 253 | 7,007 36 |
| Average | 36,075 | 24,613 | 12,242 | 12,371 | 11,462 | 4,716 | 6,746 |