Student Population by Gender
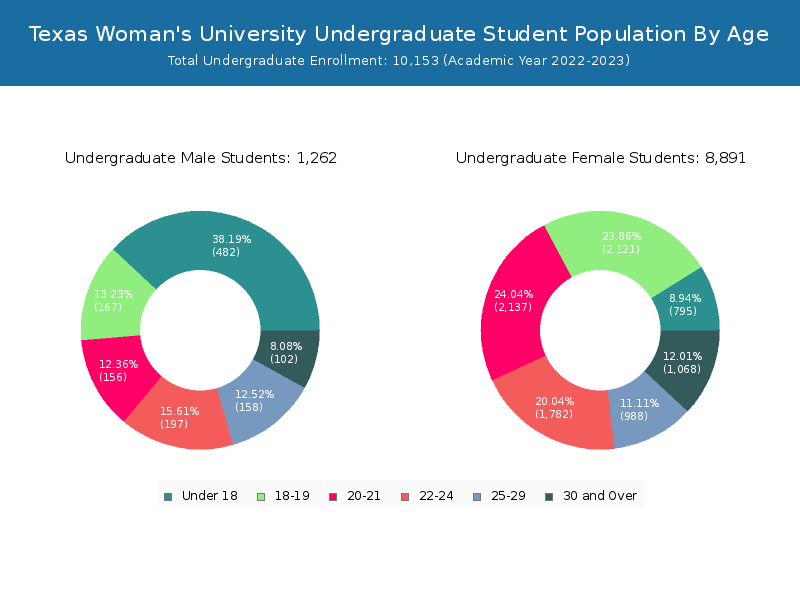
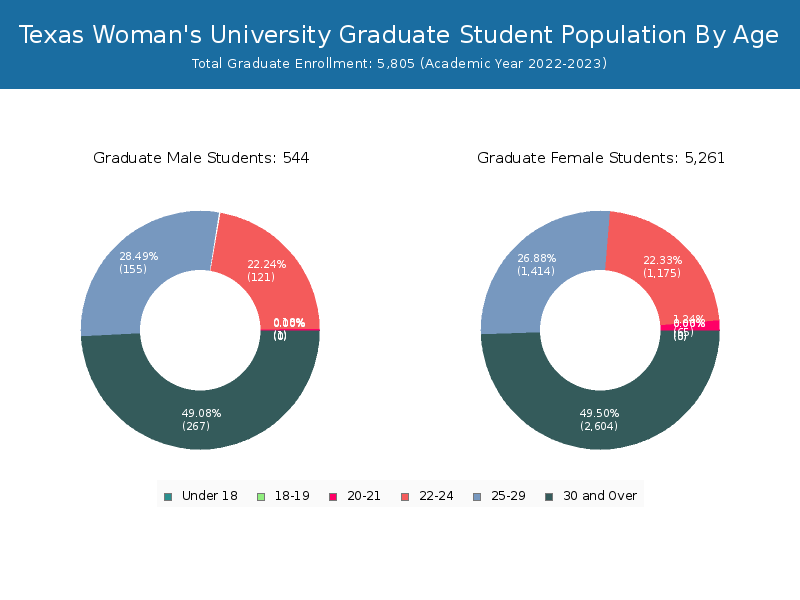
Texas Woman's University has a total of 15,958 enrolled students for the academic year 2022-2023. 10,153 students have enrolled in undergraduate programs and 5,805 students joined graduate programs.
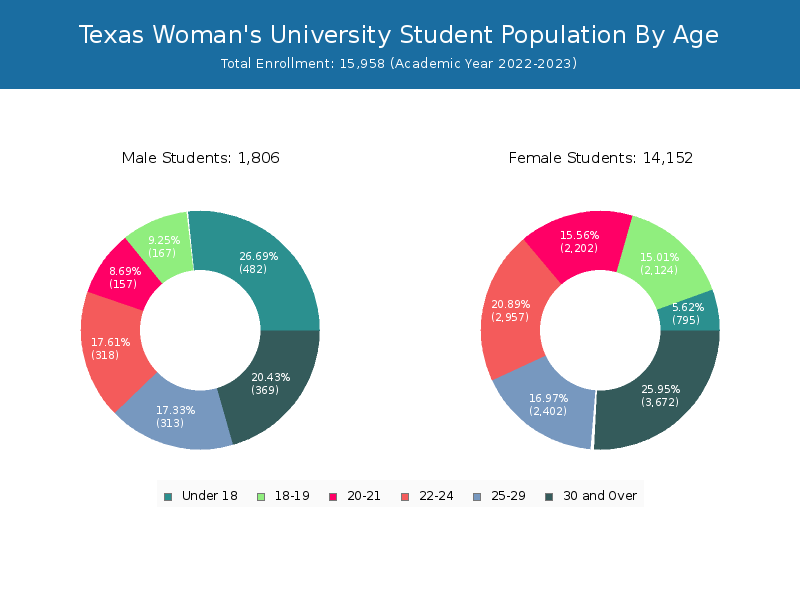
By gender, 1,806 male and 14,152 female students (the male-female ratio is 11:89) are attending the school. The gender distribution is based on the 2022-2023 data.
| Total | Undergraduate | Graduate | |
|---|---|---|---|
| Total | 15,958 | 10,153 | 5,805 |
| Men | 1,806 | 1,262 | 544 |
| Women | 14,152 | 8,891 | 5,261 |
Student Distribution by Race/Ethnicity
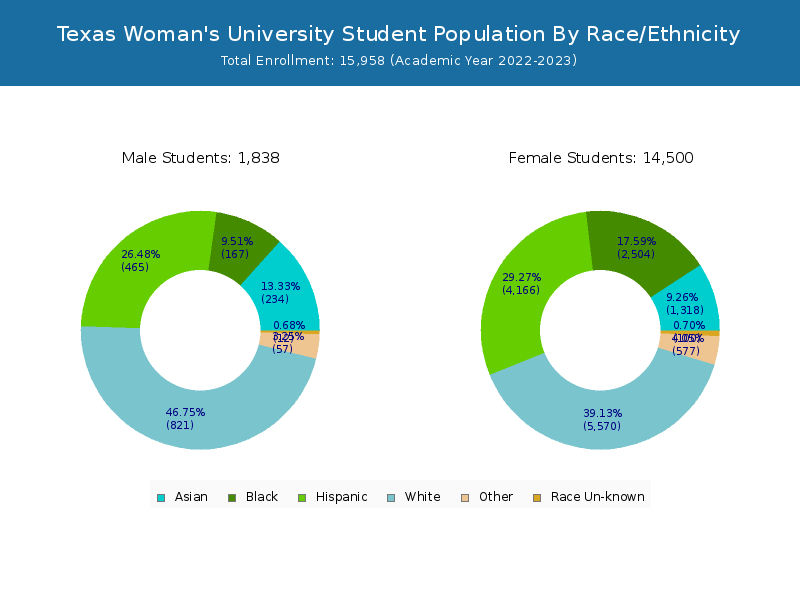
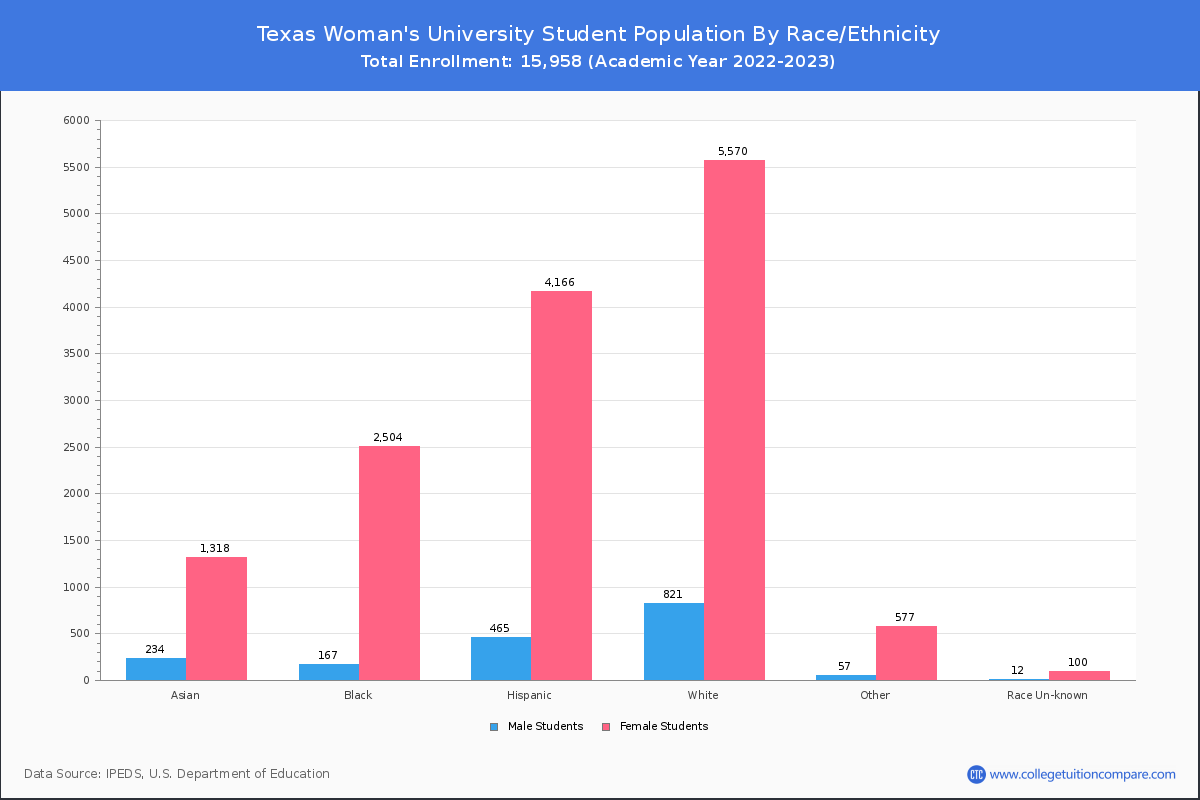
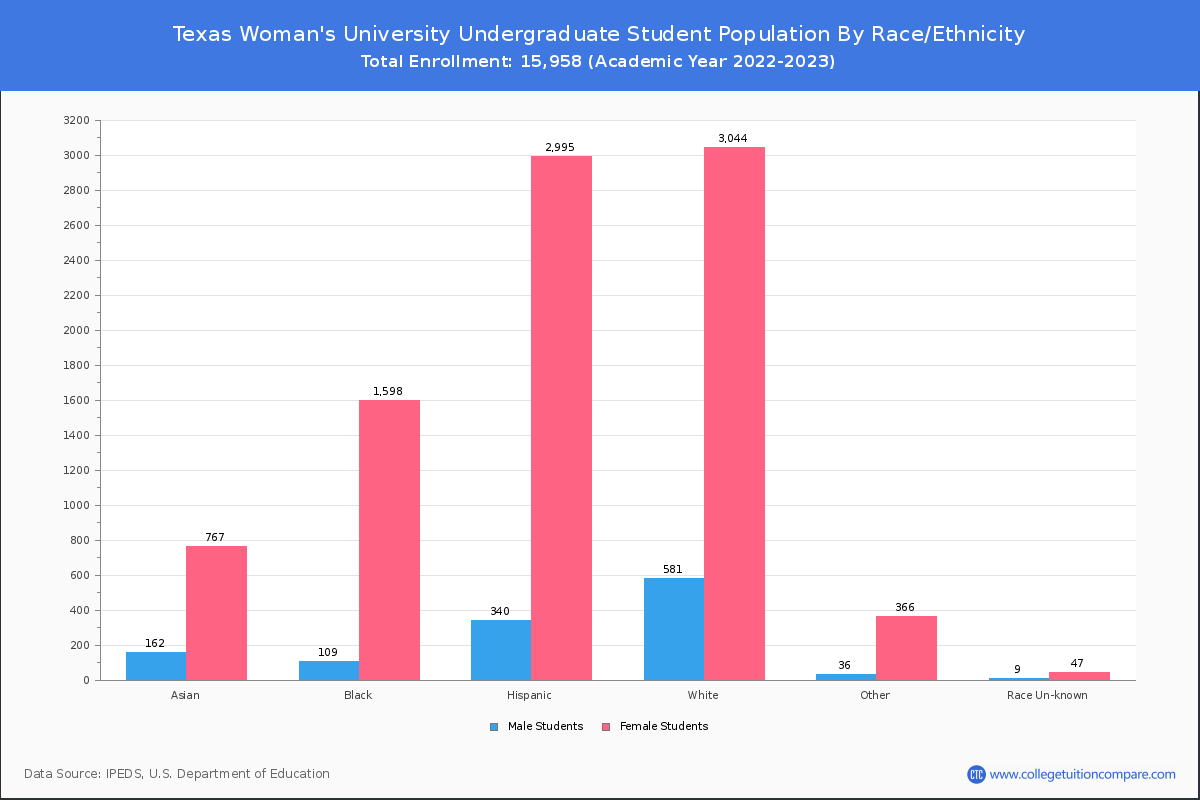
By race/ethnicity, 5,893 White, 2,666 Black, and 1,550 Asian students out of a total of 15,958 are attending at Texas Woman's University. Comprehensive enrollment statistic data by race/ethnicity is shown in the next chart (Academic year 2022-2023 data).
| Race | Total | Men | Women |
|---|---|---|---|
| American Indian or Native American | 48 | 4 | 44 |
| Asian | 1,550 | 231 | 1,319 |
| Black | 2,666 | 189 | 2,477 |
| Hispanic | 4,754 | 484 | 4,270 |
| Native Hawaiian or Other Pacific Islanders | 11 | 0 | 11 |
| White | 5,893 | 764 | 5,129 |
| Two or more races | 567 | 59 | 508 |
| Race Unknown | 206 | 28 | 178 |
| Race | Total | Men | Women |
|---|---|---|---|
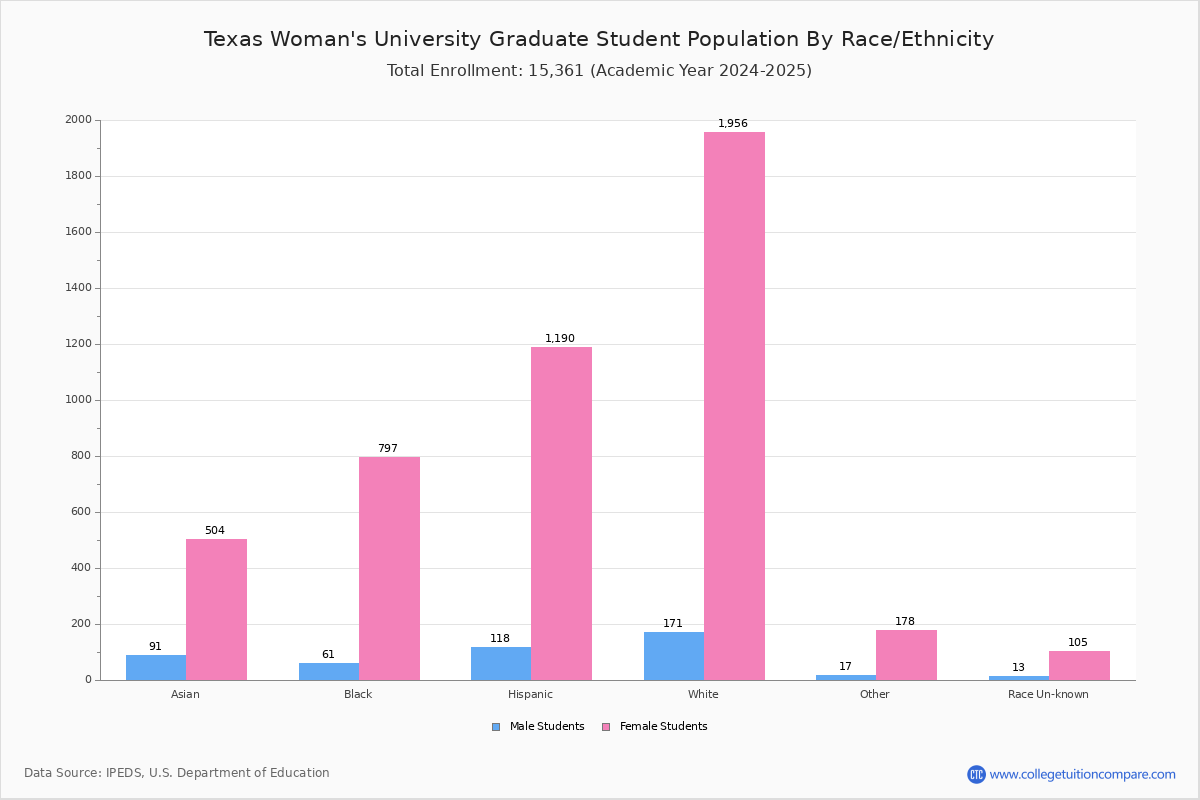
| American Indian or Native American | 34 | 2 | 32 |
| Asian | 922 | 146 | 776 |
| Black | 1,748 | 122 | 1,626 |
| Hispanic | 3,464 | 354 | 3,110 |
| Native Hawaiian or Other Pacific Islanders | 8 | 0 | 8 |
| White | 3,302 | 545 | 2,757 |
| Two or more races | 378 | 41 | 337 |
| Race Unknown | 132 | 24 | 108 |
| Race | Total | Men | Women |
|---|---|---|---|
| American Indian or Native American | 5 | 0 | 5 |
| Asian | 111 | 12 | 99 |
| Black | 246 | 20 | 226 |
| Hispanic | 425 | 33 | 392 |
| Native Hawaiian or Other Pacific Islanders | 2 | 0 | 2 |
| White | 364 | 46 | 318 |
| Two or more races | 46 | 7 | 39 |
| Race Unknown | 22 | 3 | 19 |
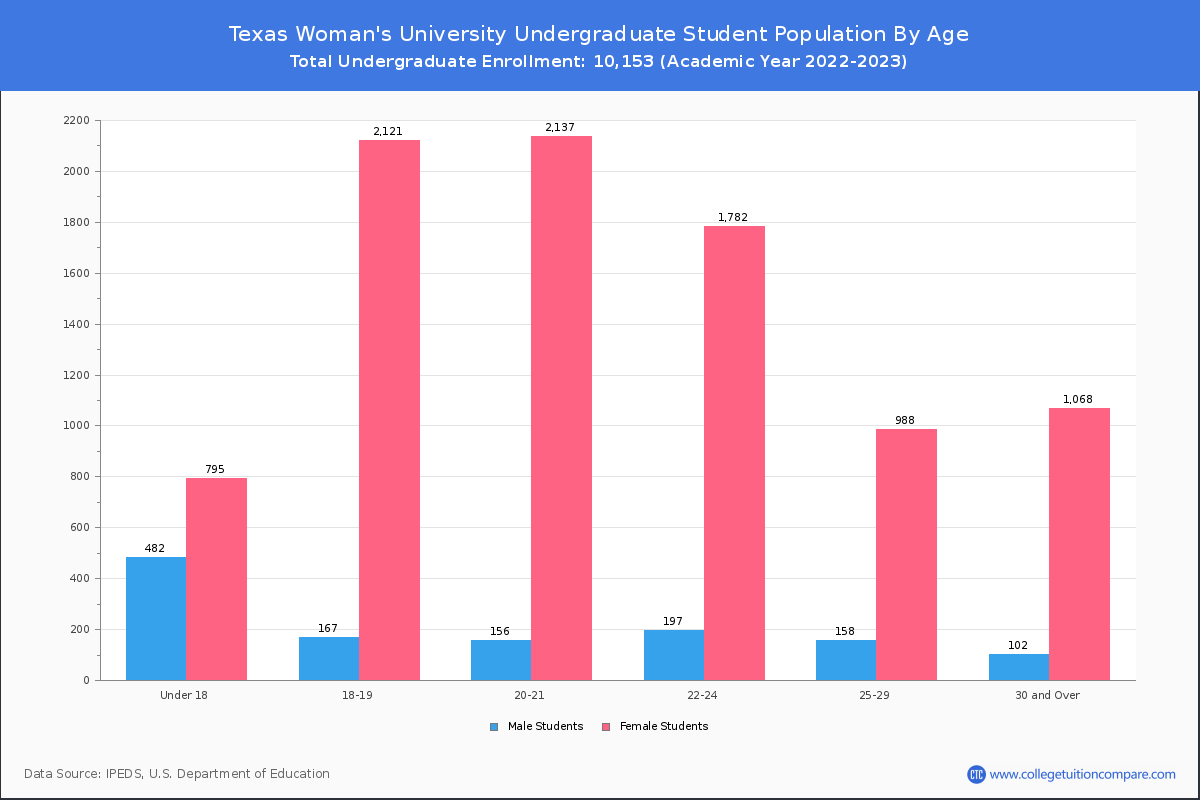
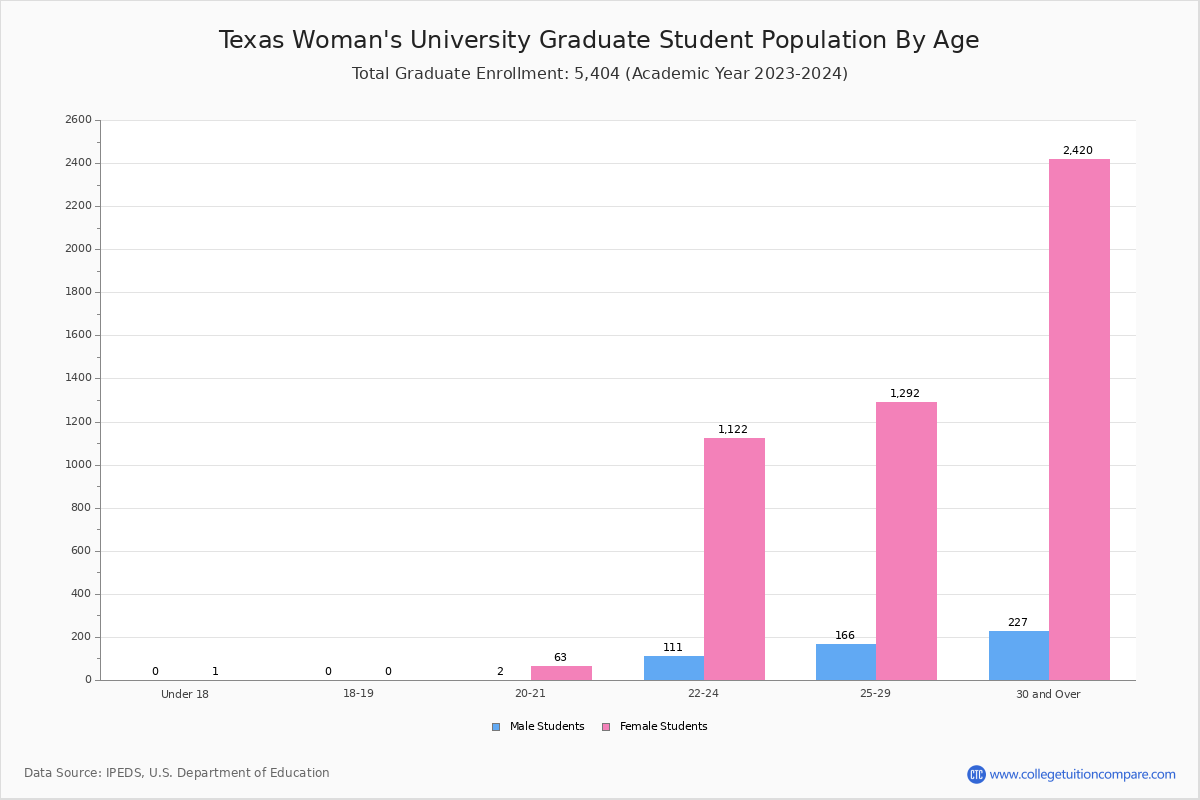
Student Age Distribution
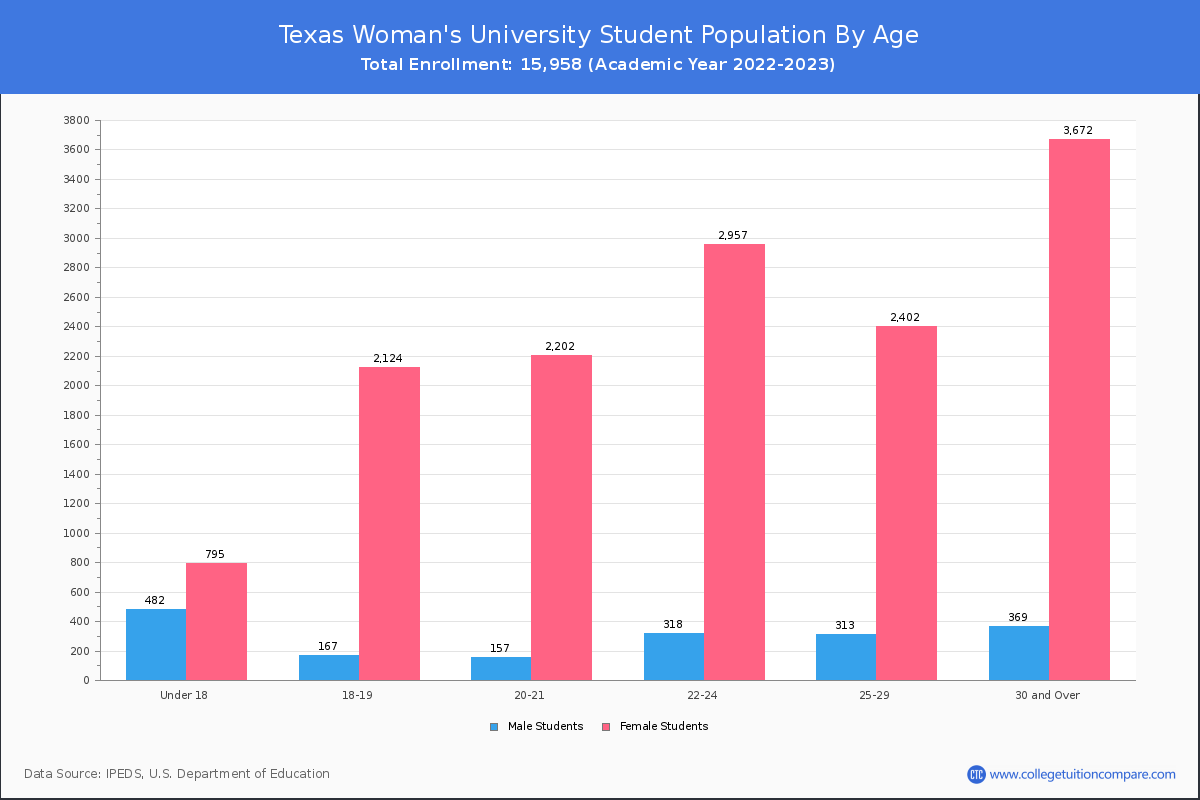
By age, TWU has 1,277 students under 18 years old and 25 students over 65 years old. There are 9,202 students under 25 years old, and 6,756 students over 25 years old out of 15,958 total students.
In undergraduate programs, 1,277 students are younger than 18 and 11 students are older than 65. TWU has 7,837 undergraduate students aged under 25 and 2,316 students aged 25 and over.
It has 1,365 graduate students aged under 25 and 4,440 students aged 25 and over.
| Age | Total | Men | Women |
|---|---|---|---|
| Under 18 | 1,277 | 795 | 482 |
| 18-19 | 2,291 | 2,124 | 167 |
| 20-21 | 2,359 | 2,202 | 157 |
| 22-24 | 3,275 | 2,957 | 318 |
| 25-29 | 2,715 | 2,402 | 313 |
| 30-34 | 1,447 | 1,303 | 144 |
| 35-39 | 981 | 898 | 83 |
| 40-49 | 1,132 | 1,034 | 98 |
| 50-64 | 456 | 418 | 38 |
| Over 65 | 25 | 19 | 6 |
| Age | Total | Men | Women |
|---|---|---|---|
| Under 18 | 1,277 | 795 | 482 |
| 18-19 | 2,288 | 2,121 | 167 |
| 20-21 | 2,293 | 2,137 | 156 |
| 22-24 | 1,979 | 1,782 | 197 |
| 25-29 | 1,146 | 988 | 158 |
| 30-34 | 479 | 433 | 46 |
| 35-39 | 286 | 261 | 25 |
| 40-49 | 283 | 262 | 21 |
| 50-64 | 111 | 102 | 9 |
| Over 65 | 11 | 10 | 1 |
| Age | Total | Men | Women |
|---|
Online Student Enrollment
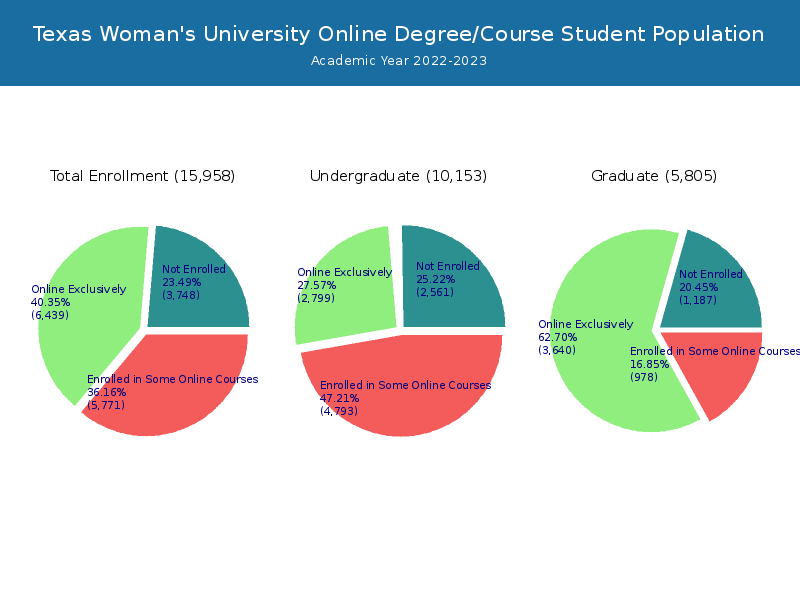
Distance learning, also called online education, is very attractive to students, especially who want to continue education and work in field. At Texas Woman's University, 6,439 students are enrolled exclusively in online courses and 5,771 students are enrolled in some online courses.
5,951 students lived in Texas or jurisdiction in which the school is located are enrolled exclusively in online courses and 488 students live in other State or outside of the United States.
| All Students | Enrolled Exclusively Online Courses | Enrolled in Some Online Courses | |
|---|---|---|---|
| All Students | 15,958 | 6,439 | 5,771 |
| Undergraduate | 10,153 | 2,799 | 4,793 |
| Graduate | 5,805 | 3,640 | 978 |
| Texas Residents | Other States in U.S. | Outside of U.S. | |
|---|---|---|---|
| All Students | 5,951 | 486 | 2 |
| Undergraduate | 2,737 | 62 | 0 |
| Graduate | 3,214 | 424 | 2 |
Transfer-in Students (Undergraduate)
Among 10,153 enrolled in undergraduate programs, 1,240 students have transferred-in from other institutions. The percentage of transfer-in students is 12.21%.782 students have transferred in as full-time status and 458 students transferred in as part-time status.
| Number of Students | |
|---|---|
| Regular Full-time | 5,840 |
| Transfer-in Full-time | 782 |
| Regular Part-time | 3,073 |
| Transfer-in Part-time | 458 |