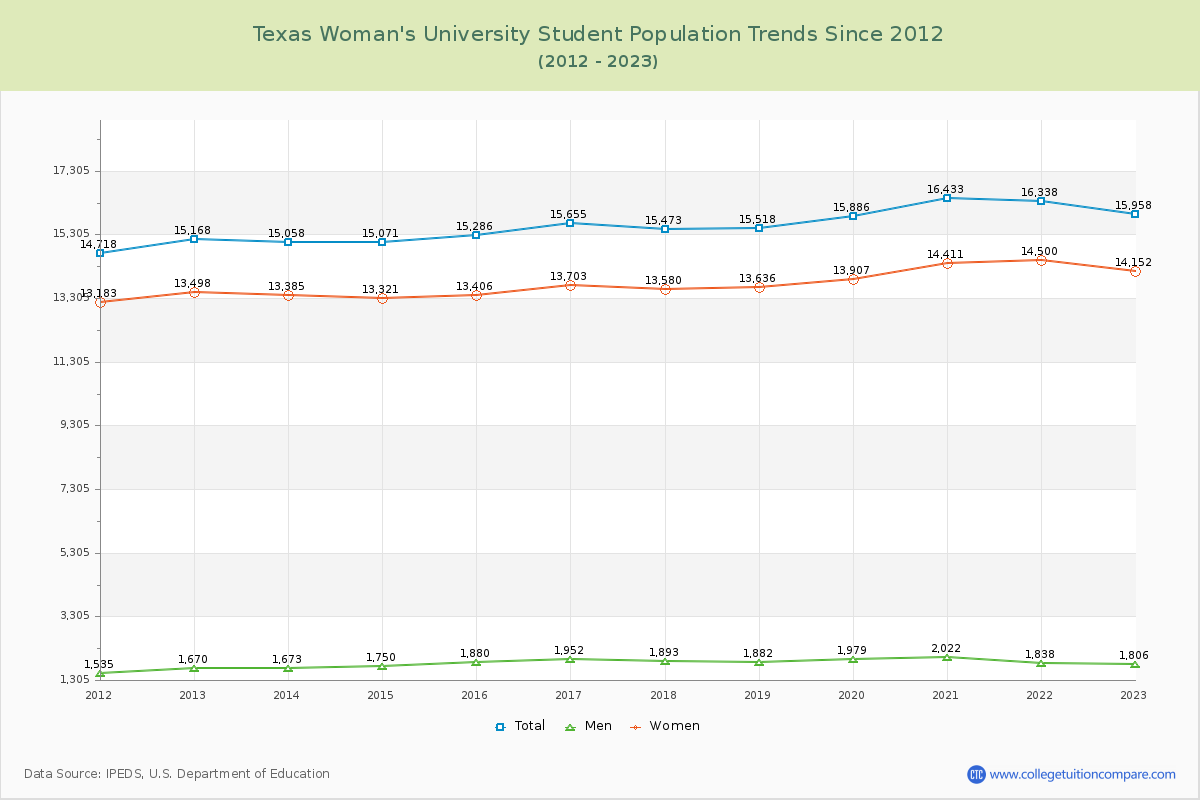
Student Population Changes
The average student population over the last 12 years is 15,622 where 15,958 students are attending the school for the academic year 2022-2023.
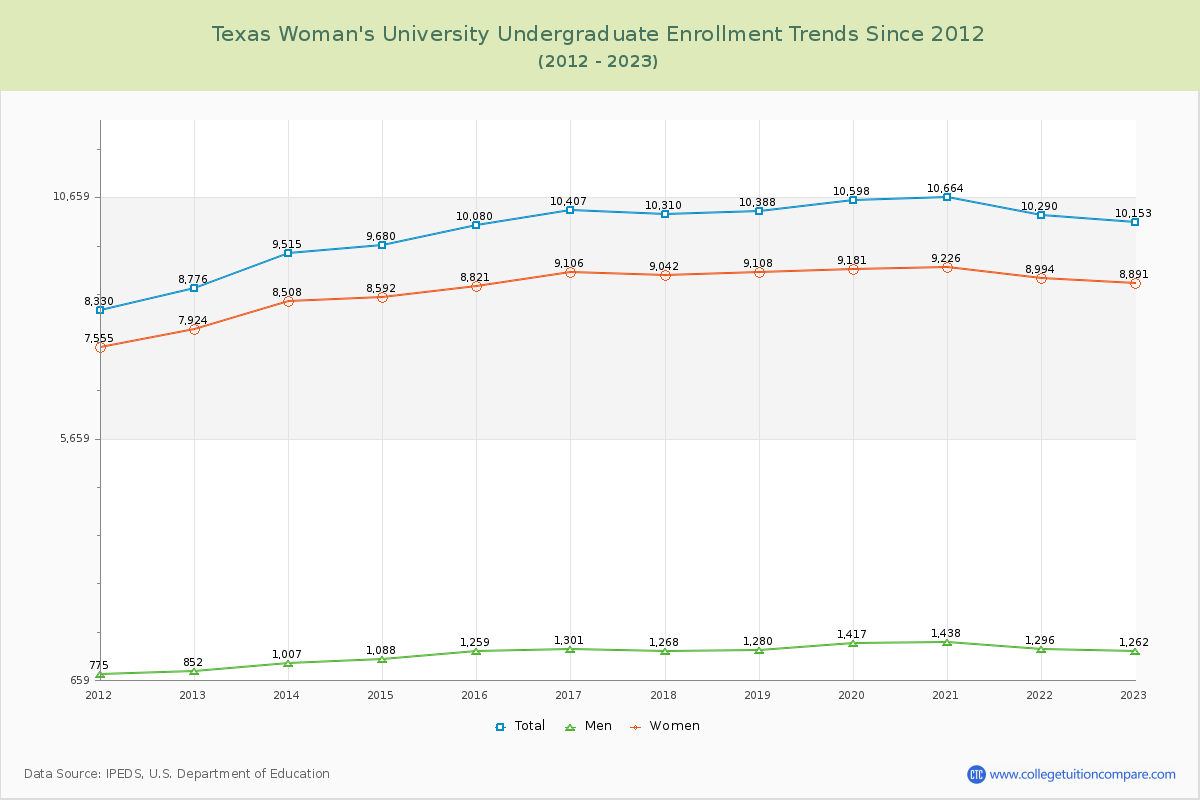
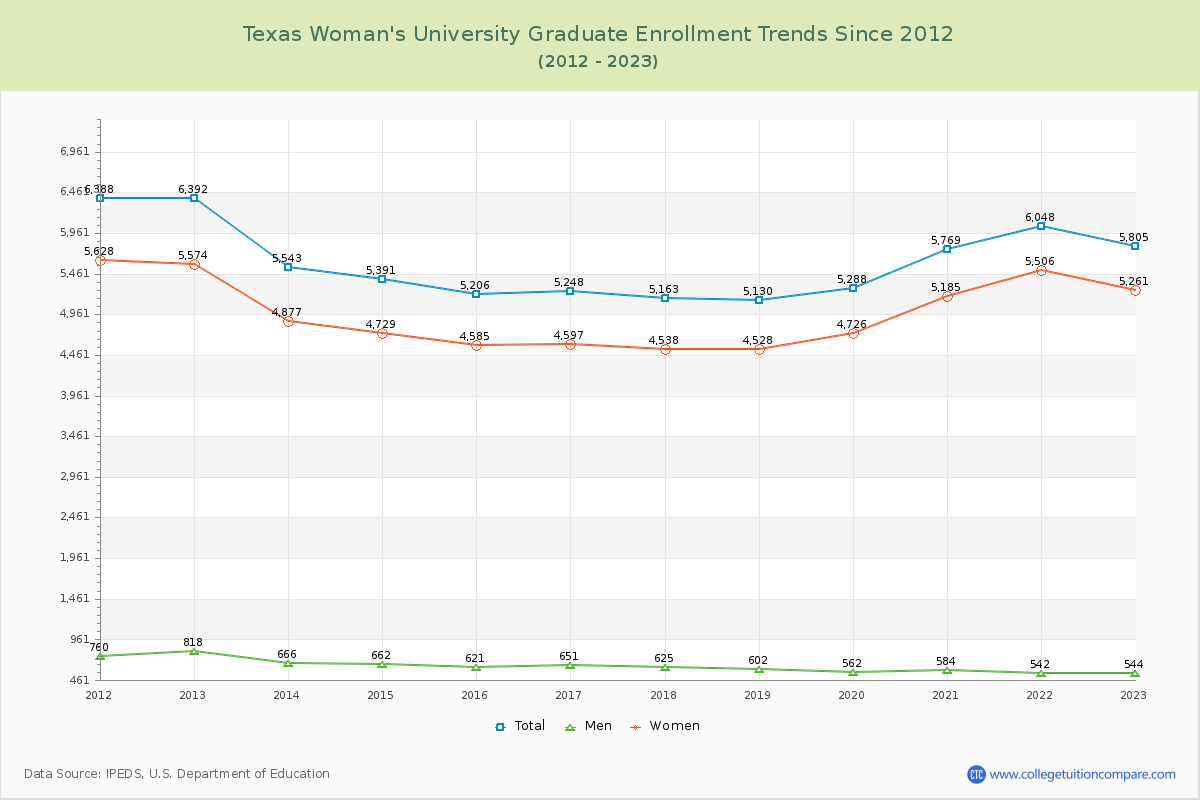
63.62% of total students is undergraduate students and 36.38% students is graduate students. The number of undergraduate students has increased by 1,377 and the graduate enrollment has decreased by 587 over past 10 years.
The female to male ratio is 7.84 to 1 and it means that there are far more female students enrolled in TWU than male students.
The following table and chart illustrate the changes in student population by gender at Texas Woman's University since 2012.
| Year | Total | Undergraduate | Graduate | ||||
|---|---|---|---|---|---|---|---|
| Total | Men | Women | Total | Men | Women | ||
| 2012-13 | 15,168 | 8,776 | 852 | 7,924 | 6,392 | 818 | 5,574 |
| 2013-14 | 15,058 -110 | 9,515 739 | 1,007 155 | 8,508 584 | 5,543 -849 | 666 -152 | 4,877 -697 |
| 2014-15 | 15,071 13 | 9,680 165 | 1,088 81 | 8,592 84 | 5,391 -152 | 662 -4 | 4,729 -148 |
| 2015-16 | 15,286 215 | 10,080 400 | 1,259 171 | 8,821 229 | 5,206 -185 | 621 -41 | 4,585 -144 |
| 2016-17 | 15,655 369 | 10,407 327 | 1,301 42 | 9,106 285 | 5,248 42 | 651 30 | 4,597 12 |
| 2017-18 | 15,473 -182 | 10,310 -97 | 1,268 -33 | 9,042 -64 | 5,163 -85 | 625 -26 | 4,538 -59 |
| 2018-19 | 15,518 45 | 10,388 78 | 1,280 12 | 9,108 66 | 5,130 -33 | 602 -23 | 4,528 -10 |
| 2019-20 | 15,886 368 | 10,598 210 | 1,417 137 | 9,181 73 | 5,288 158 | 562 -40 | 4,726 198 |
| 2020-21 | 16,433 547 | 10,664 66 | 1,438 21 | 9,226 45 | 5,769 481 | 584 22 | 5,185 459 |
| 2021-22 | 16,338 -95 | 10,290 -374 | 1,296 -142 | 8,994 -232 | 6,048 279 | 542 -42 | 5,506 321 |
| 2022-23 | 15,958 -380 | 10,153 -137 | 1,262 -34 | 8,891 -103 | 5,805 -243 | 544 2 | 5,261 -245 |
| Average | 15,622 | 10,078 | 1,224 | 8,854 | 5,544 | 625 | 4,919 |