Student Population by Gender
Texas A & M University-Kingsville has a total of 6,092 enrolled students for the academic year 2022-2023. 4,847 students have enrolled in undergraduate programs and 1,245 students joined graduate programs.
By gender, 3,017 male and 3,075 female students (the male-female ratio is 50:50) are attending the school. The gender distribution is based on the 2022-2023 data.
| Total | Undergraduate | Graduate | |
|---|---|---|---|
| Total | 6,092 | 4,847 | 1,245 |
| Men | 3,017 | 2,391 | 626 |
| Women | 3,075 | 2,456 | 619 |
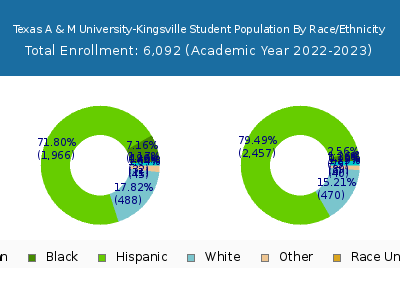
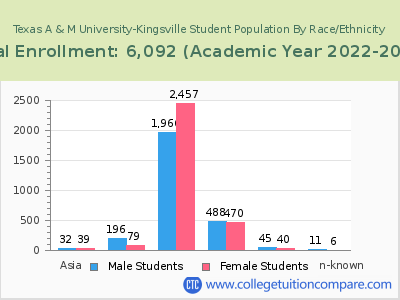
Student Distribution by Race/Ethnicity
| Race | Total | Men | Women |
|---|---|---|---|
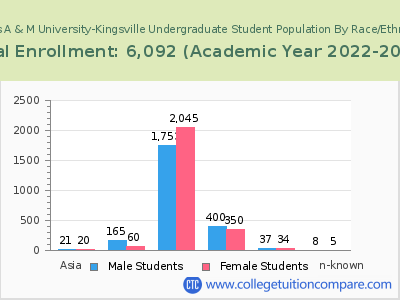
| American Indian or Native American | 7 | 2 | 5 |
| Asian | 55 | 33 | 22 |
| Black | 245 | 172 | 73 |
| Hispanic | 4,244 | 1,882 | 2,362 |
| Native Hawaiian or Other Pacific Islanders | 3 | 3 | 0 |
| White | 874 | 454 | 420 |
| Two or more races | 69 | 33 | 36 |
| Race Unknown | 16 | 9 | 7 |
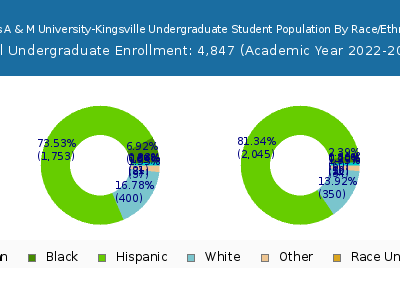
| Race | Total | Men | Women |
|---|---|---|---|
| American Indian or Native American | 7 | 2 | 5 |
| Asian | 37 | 21 | 16 |
| Black | 203 | 149 | 54 |
| Hispanic | 3,677 | 1,688 | 1,989 |
| Native Hawaiian or Other Pacific Islanders | 3 | 3 | 0 |
| White | 703 | 383 | 320 |
| Two or more races | 56 | 26 | 30 |
| Race Unknown | 13 | 6 | 7 |
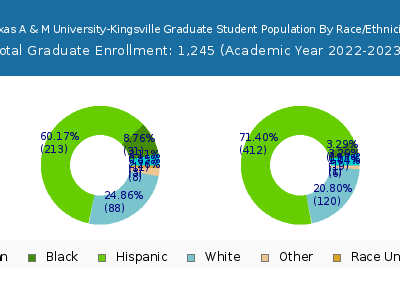
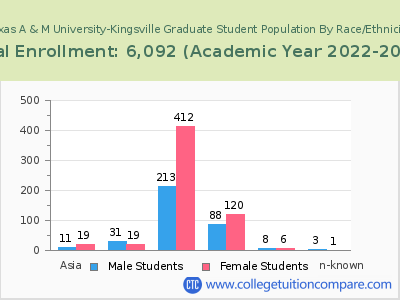
| Race | Total | Men | Women |
|---|---|---|---|
| American Indian or Native American | 2 | 0 | 2 |
| Asian | 1 | 0 | 1 |
| Black | 20 | 17 | 3 |
| Hispanic | 206 | 77 | 129 |
| Native Hawaiian or Other Pacific Islanders | 1 | 1 | 0 |
| White | 65 | 33 | 32 |
| Two or more races | 5 | 0 | 5 |
| Race Unknown | 1 | 0 | 1 |
Student Age Distribution
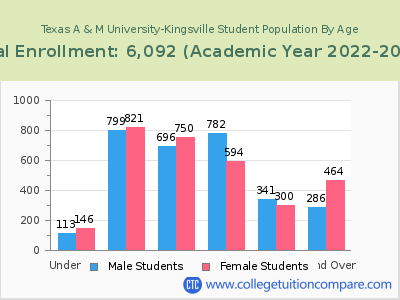
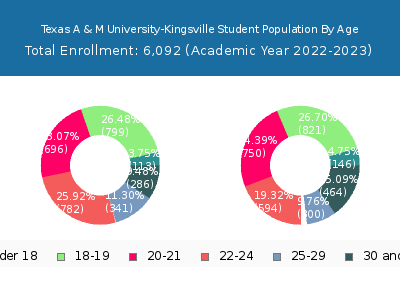
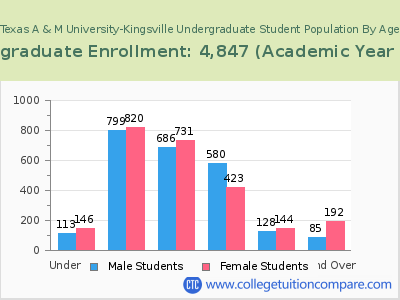
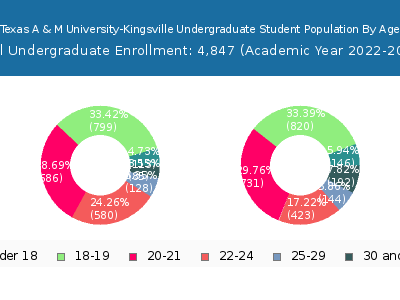
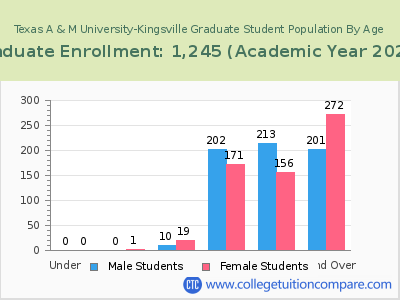
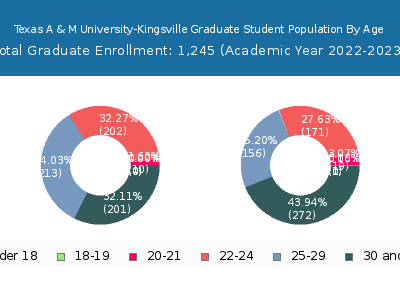
By age, TAMU-Kingsville has 259 students under 18 years old and 8 students over 65 years old. There are 4,701 students under 25 years old, and 1,391 students over 25 years old out of 6,092 total students.
In undergraduate programs, 259 students are younger than 18 and 1 students are older than 65. TAMU-Kingsville has 4,298 undergraduate students aged under 25 and 549 students aged 25 and over.
It has 403 graduate students aged under 25 and 842 students aged 25 and over.
| Age | Total | Men | Women |
|---|---|---|---|
| Under 18 | 259 | 146 | 113 |
| 18-19 | 1,620 | 821 | 799 |
| 20-21 | 1,446 | 750 | 696 |
| 22-24 | 1,376 | 594 | 782 |
| 25-29 | 641 | 300 | 341 |
| 30-34 | 290 | 163 | 127 |
| 35-39 | 185 | 126 | 59 |
| 40-49 | 193 | 124 | 69 |
| 50-64 | 74 | 49 | 25 |
| Over 65 | 8 | 2 | 6 |
| Age | Total | Men | Women |
|---|---|---|---|
| Under 18 | 259 | 146 | 113 |
| 18-19 | 1,619 | 820 | 799 |
| 20-21 | 1,417 | 731 | 686 |
| 22-24 | 1,003 | 423 | 580 |
| 25-29 | 272 | 144 | 128 |
| 30-34 | 114 | 71 | 43 |
| 35-39 | 73 | 53 | 20 |
| 40-49 | 62 | 45 | 17 |
| 50-64 | 27 | 22 | 5 |
| Over 65 | 1 | 1 | 0 |
| Age | Total | Men | Women |
|---|
Online Student Enrollment
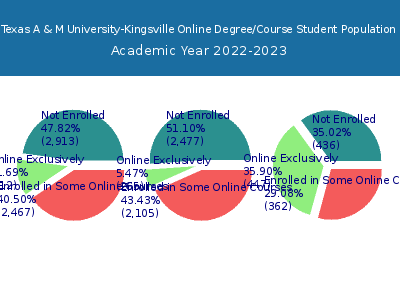
Distance learning, also called online education, is very attractive to students, especially who want to continue education and work in field. At Texas A & M University-Kingsville, 712 students are enrolled exclusively in online courses and 2,467 students are enrolled in some online courses.
678 students lived in Texas or jurisdiction in which the school is located are enrolled exclusively in online courses and 34 students live in other State or outside of the United States.
| All Students | Enrolled Exclusively Online Courses | Enrolled in Some Online Courses | |
|---|---|---|---|
| All Students | 6,092 | 712 | 2,467 |
| Undergraduate | 4,847 | 265 | 2,105 |
| Graduate | 1,245 | 447 | 362 |
| Texas Residents | Other States in U.S. | Outside of U.S. | |
|---|---|---|---|
| All Students | 678 | 24 | 10 |
| Undergraduate | 261 | 3 | 1 |
| Graduate | 417 | 21 | 9 |
Transfer-in Students (Undergraduate)
Among 4,847 enrolled in undergraduate programs, 307 students have transferred-in from other institutions. The percentage of transfer-in students is 6.33%.260 students have transferred in as full-time status and 47 students transferred in as part-time status.
| Number of Students | |
|---|---|
| Regular Full-time | 3,652 |
| Transfer-in Full-time | 260 |
| Regular Part-time | 888 |
| Transfer-in Part-time | 47 |
