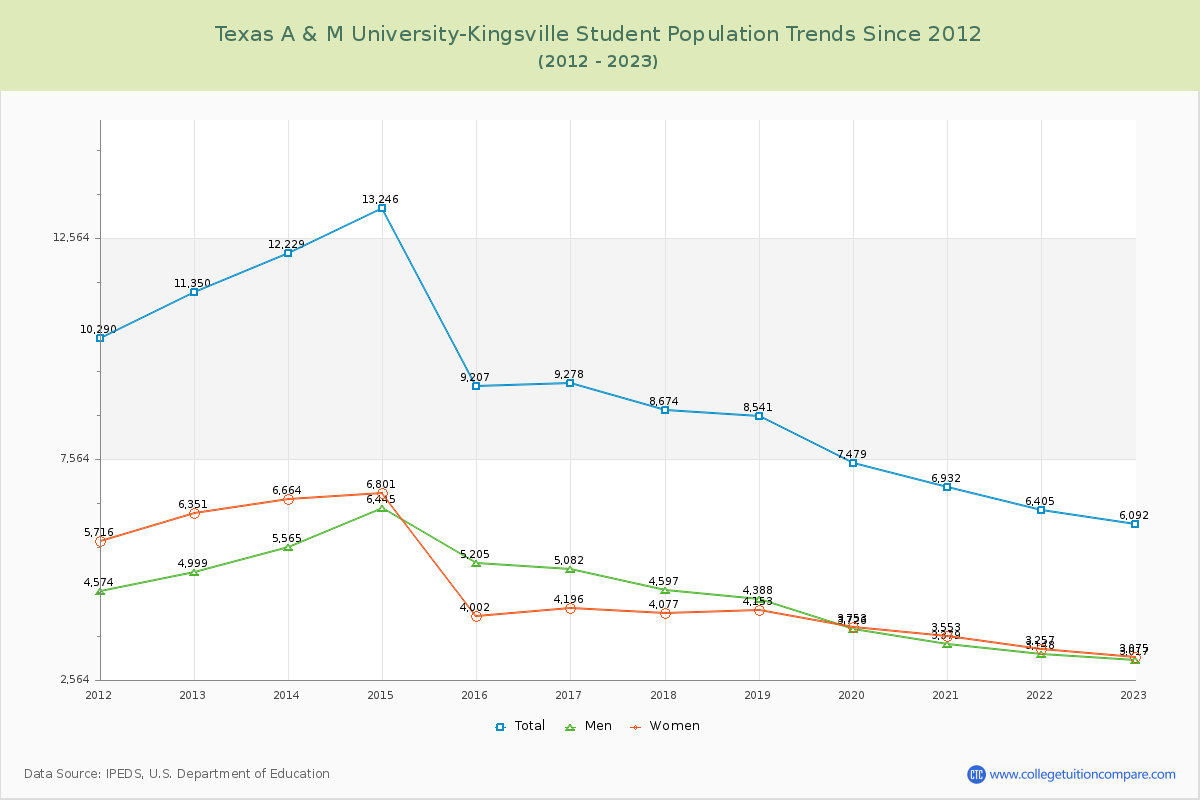
Student Population Changes
The average student population over the last 12 years is 9,039 where 6,092 students are attending the school for the academic year 2022-2023.
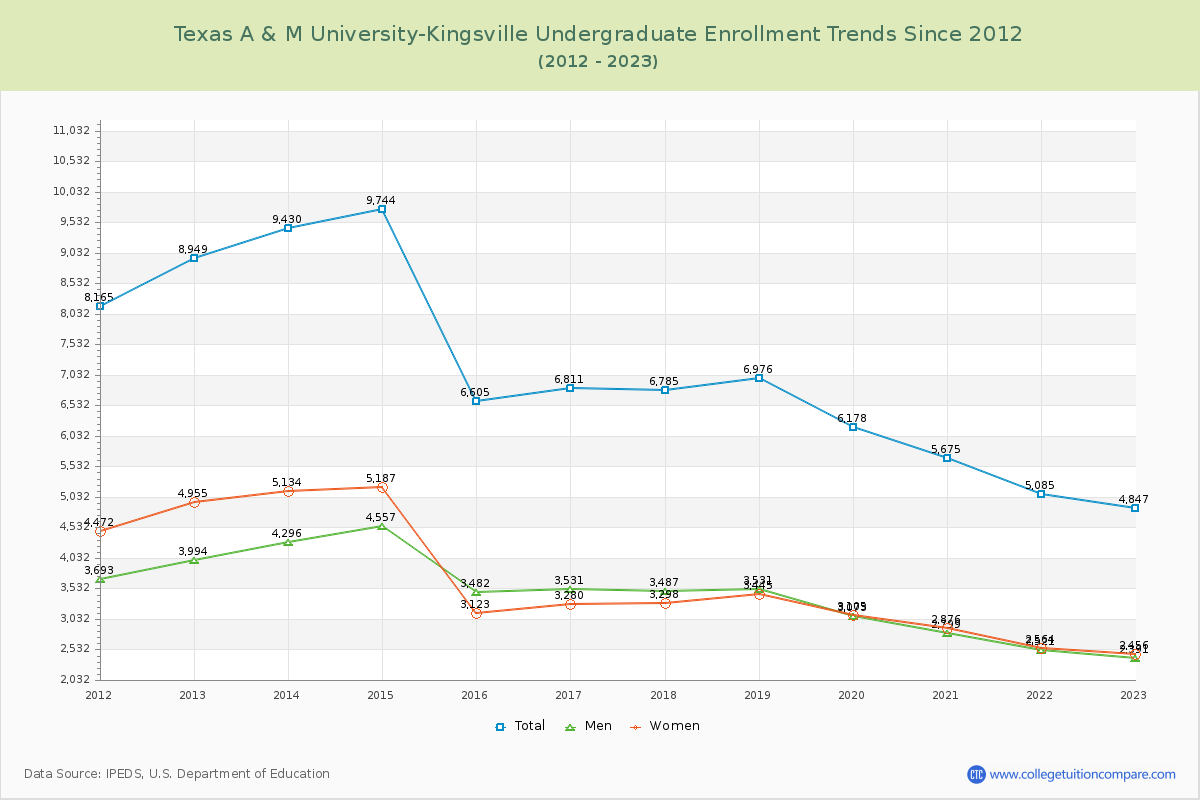
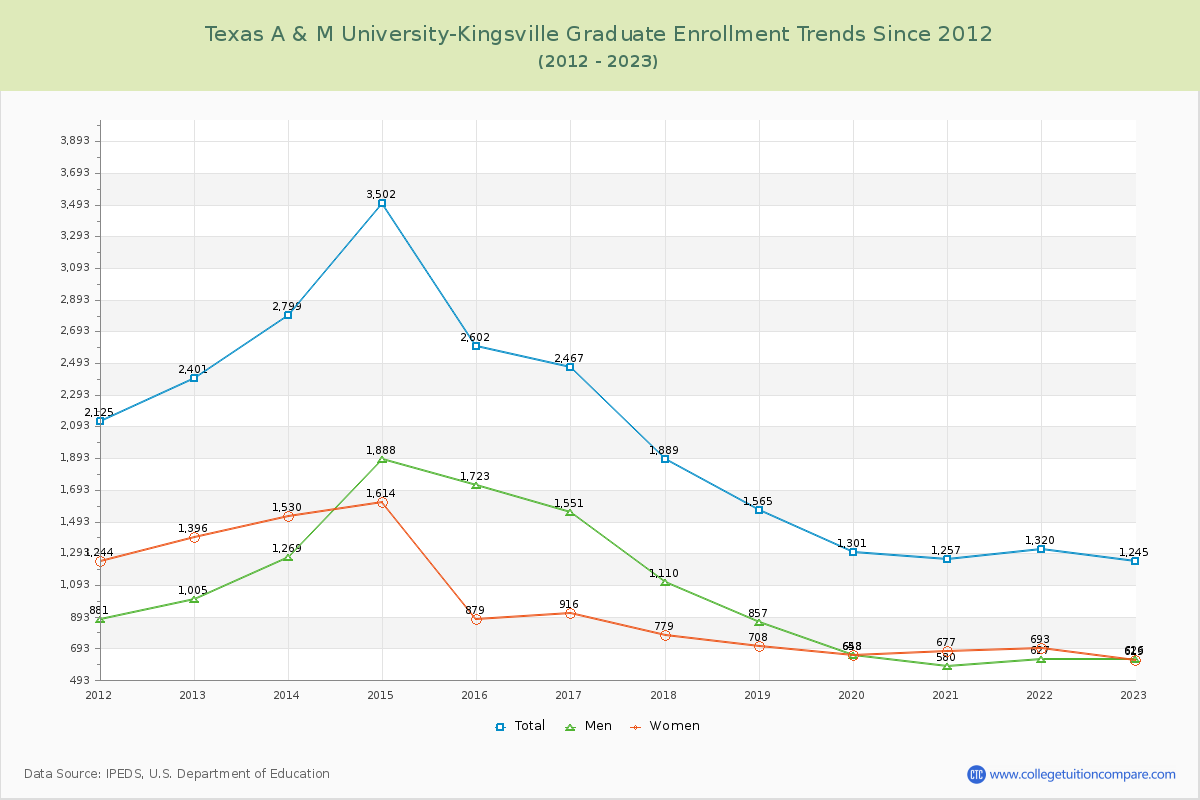
79.56% of total students is undergraduate students and 20.44% students is graduate students. The number of undergraduate students has decreased by 4,102 and the graduate enrollment has decreased by 1,156 over past 10 years.
The female to male ratio is 1.02 to 1 and it means that there are similar numbers of female and male students enrolled in TAMU-Kingsville.
The following table and chart illustrate the changes in student population by gender at Texas A & M University-Kingsville since 2012.
| Year | Total | Undergraduate | Graduate | ||||
|---|---|---|---|---|---|---|---|
| Total | Men | Women | Total | Men | Women | ||
| 2012-13 | 11,350 | 8,949 | 3,994 | 4,955 | 2,401 | 1,005 | 1,396 |
| 2013-14 | 12,229 879 | 9,430 481 | 4,296 302 | 5,134 179 | 2,799 398 | 1,269 264 | 1,530 134 |
| 2014-15 | 13,246 1,017 | 9,744 314 | 4,557 261 | 5,187 53 | 3,502 703 | 1,888 619 | 1,614 84 |
| 2015-16 | 9,207 -4,039 | 6,605 -3,139 | 3,482 -1,075 | 3,123 -2,064 | 2,602 -900 | 1,723 -165 | 879 -735 |
| 2016-17 | 9,278 71 | 6,811 206 | 3,531 49 | 3,280 157 | 2,467 -135 | 1,551 -172 | 916 37 |
| 2017-18 | 8,674 -604 | 6,785 -26 | 3,487 -44 | 3,298 18 | 1,889 -578 | 1,110 -441 | 779 -137 |
| 2018-19 | 8,541 -133 | 6,976 191 | 3,531 44 | 3,445 147 | 1,565 -324 | 857 -253 | 708 -71 |
| 2019-20 | 7,479 -1,062 | 6,178 -798 | 3,073 -458 | 3,105 -340 | 1,301 -264 | 653 -204 | 648 -60 |
| 2020-21 | 6,932 -547 | 5,675 -503 | 2,799 -274 | 2,876 -229 | 1,257 -44 | 580 -73 | 677 29 |
| 2021-22 | 6,405 -527 | 5,085 -590 | 2,521 -278 | 2,564 -312 | 1,320 63 | 627 47 | 693 16 |
| 2022-23 | 6,092 -313 | 4,847 -238 | 2,391 -130 | 2,456 -108 | 1,245 -75 | 626 -1 | 619 -74 |
| Average | 9,039 | 7,008 | 3,424 | 3,584 | 2,032 | 1,081 | 951 |