Student Population by Gender
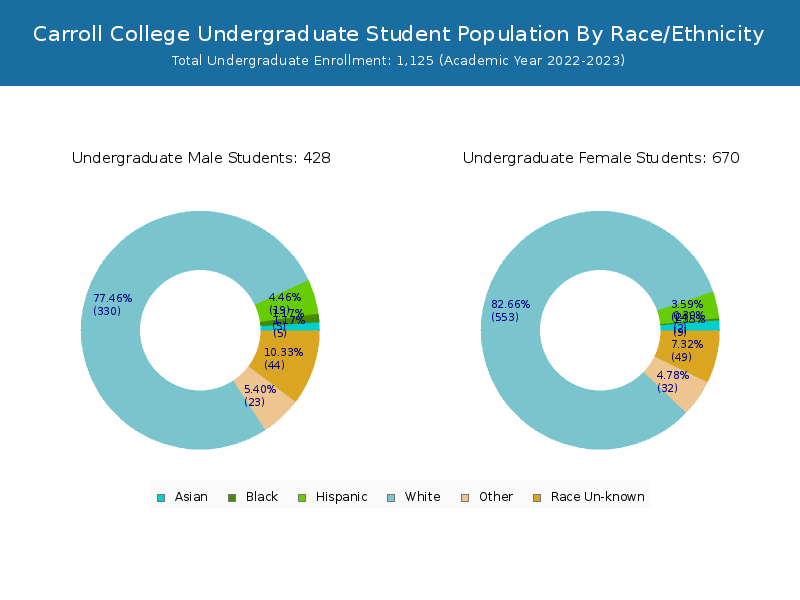
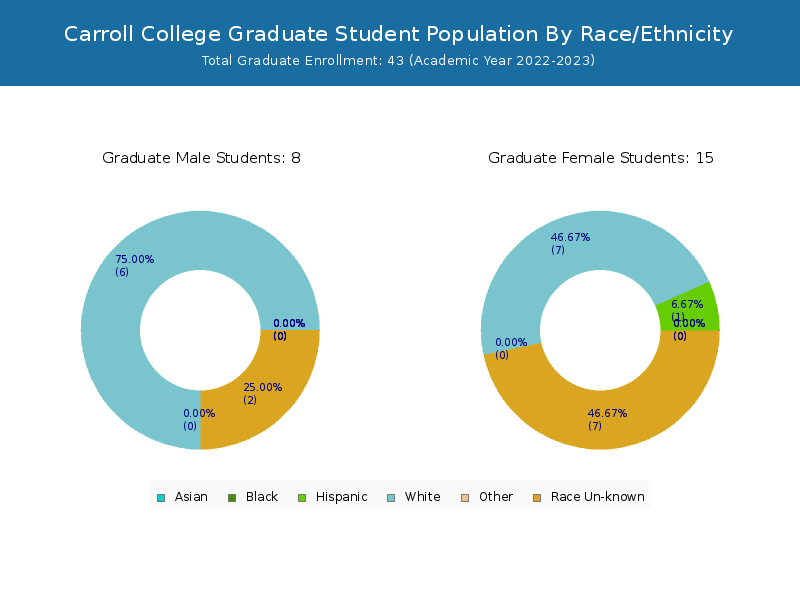
Carroll College has a total of 1,168 enrolled students for the academic year 2022-2023. 1,125 students have enrolled in undergraduate programs and 43 students joined graduate programs.
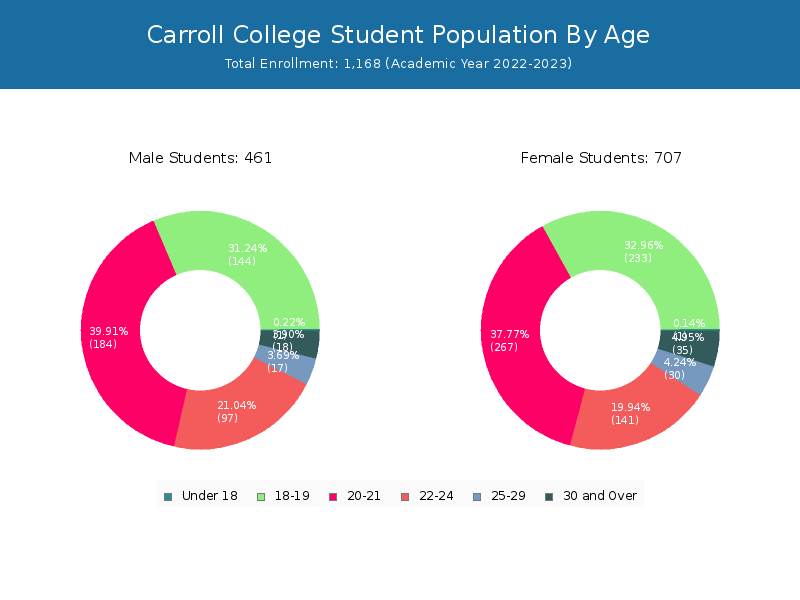
By gender, 461 male and 707 female students (the male-female ratio is 39:61) are attending the school. The gender distribution is based on the 2022-2023 data.
| Total | Undergraduate | Graduate | |
|---|---|---|---|
| Total | 1,168 | 1,125 | 43 |
| Men | 461 | 452 | 9 |
| Women | 707 | 673 | 34 |
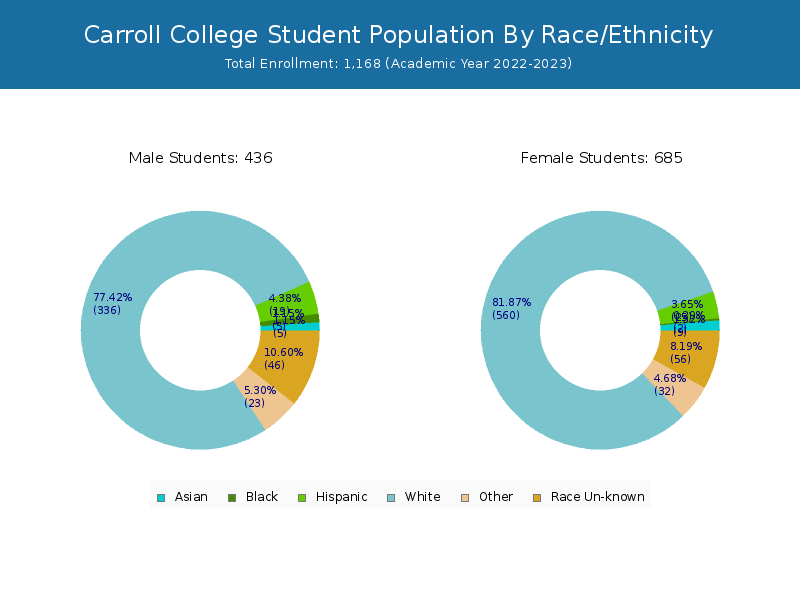
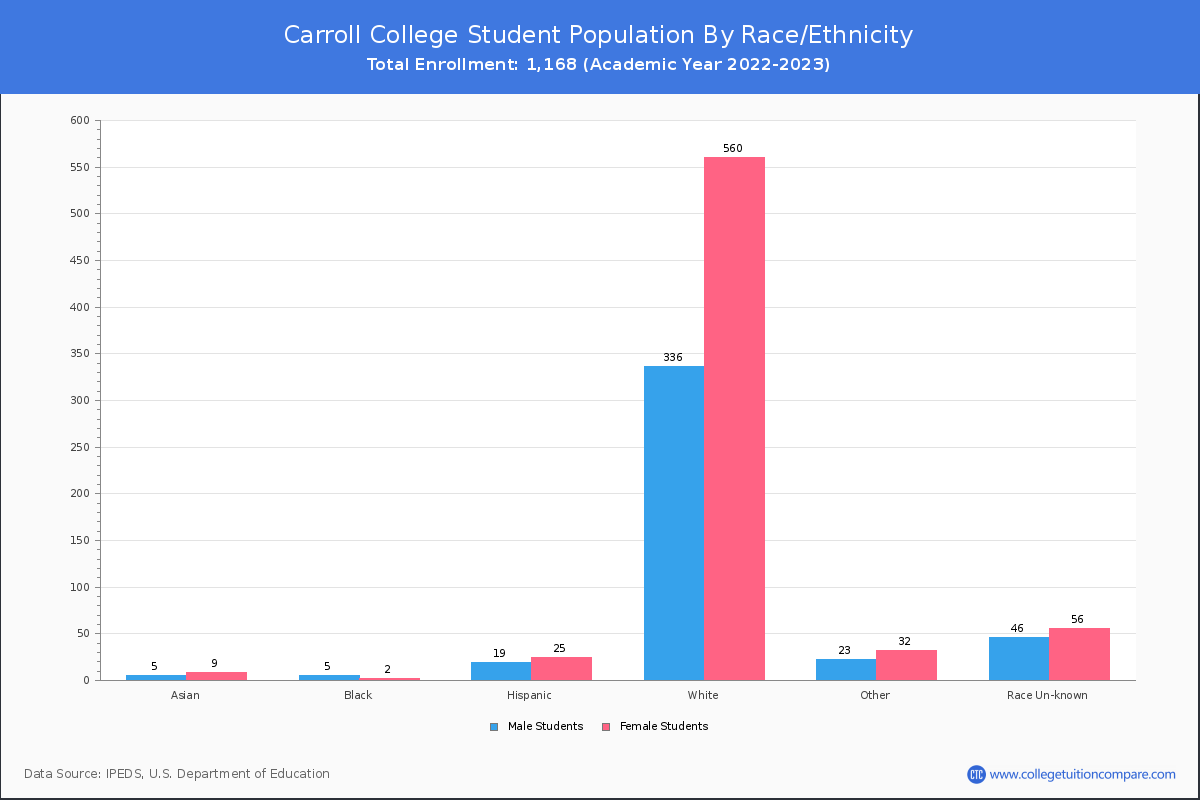
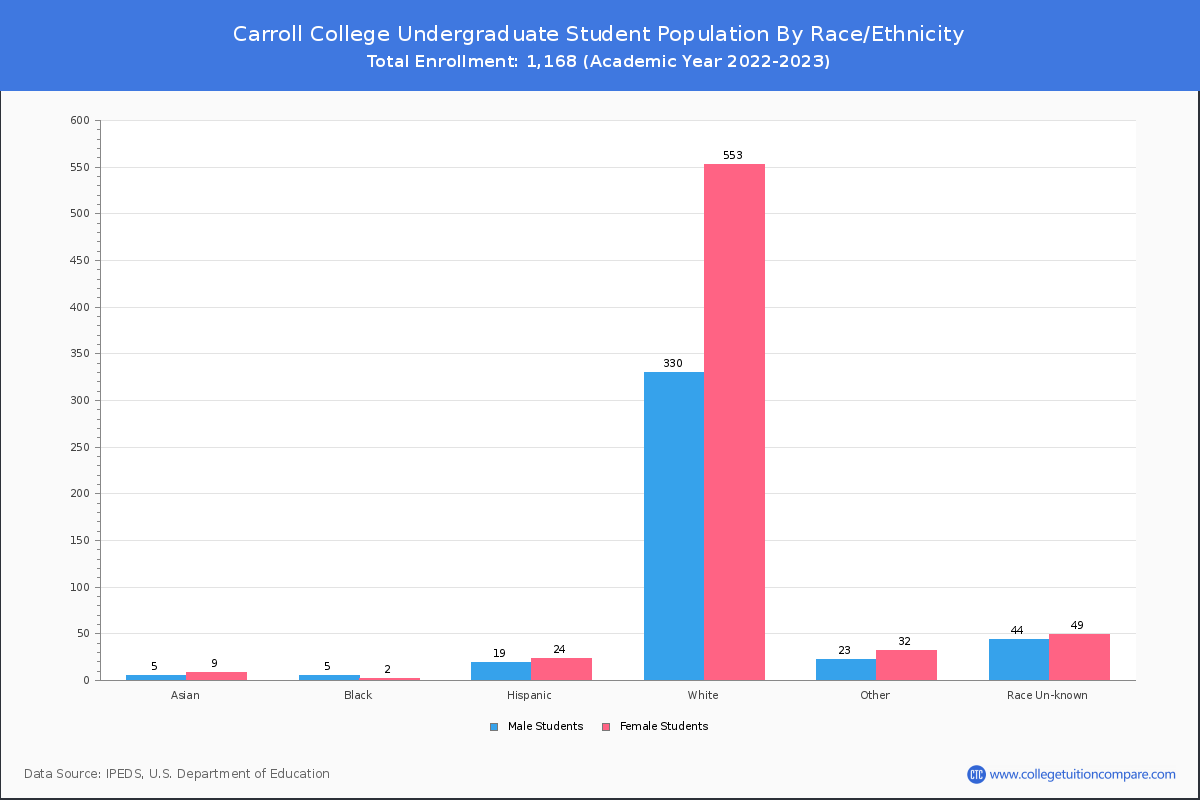
Student Distribution by Race/Ethnicity
By race/ethnicity, 906 White, 7 Black, and 15 Asian students out of a total of 1,168 are attending at Carroll College. Comprehensive enrollment statistic data by race/ethnicity is shown in the next chart (Academic year 2022-2023 data).

| Race | Total | Men | Women |
|---|---|---|---|
| American Indian or Native American | 5 | 3 | 2 |
| Asian | 15 | 8 | 7 |
| Black | 7 | 5 | 2 |
| Hispanic | 62 | 25 | 37 |
| Native Hawaiian or Other Pacific Islanders | 3 | 3 | 0 |
| White | 906 | 346 | 560 |
| Two or more races | 54 | 25 | 29 |
| Race Unknown | 105 | 41 | 64 |
| Race | Total | Men | Women |
|---|---|---|---|
| American Indian or Native American | 4 | 3 | 1 |
| Asian | 15 | 8 | 7 |
| Black | 7 | 5 | 2 |
| Hispanic | 61 | 25 | 36 |
| Native Hawaiian or Other Pacific Islanders | 3 | 3 | 0 |
| White | 890 | 341 | 549 |
| Two or more races | 54 | 25 | 29 |
| Race Unknown | 80 | 37 | 43 |
| Race | Total | Men | Women |
|---|---|---|---|
| American Indian or Native American | 0 | 0 | 0 |
| Asian | 2 | 2 | 0 |
| Black | 1 | 1 | 0 |
| Hispanic | 3 | 1 | 2 |
| Native Hawaiian or Other Pacific Islanders | 0 | 0 | 0 |
| White | 30 | 13 | 17 |
| Two or more races | 1 | 0 | 1 |
| Race Unknown | 7 | 2 | 5 |
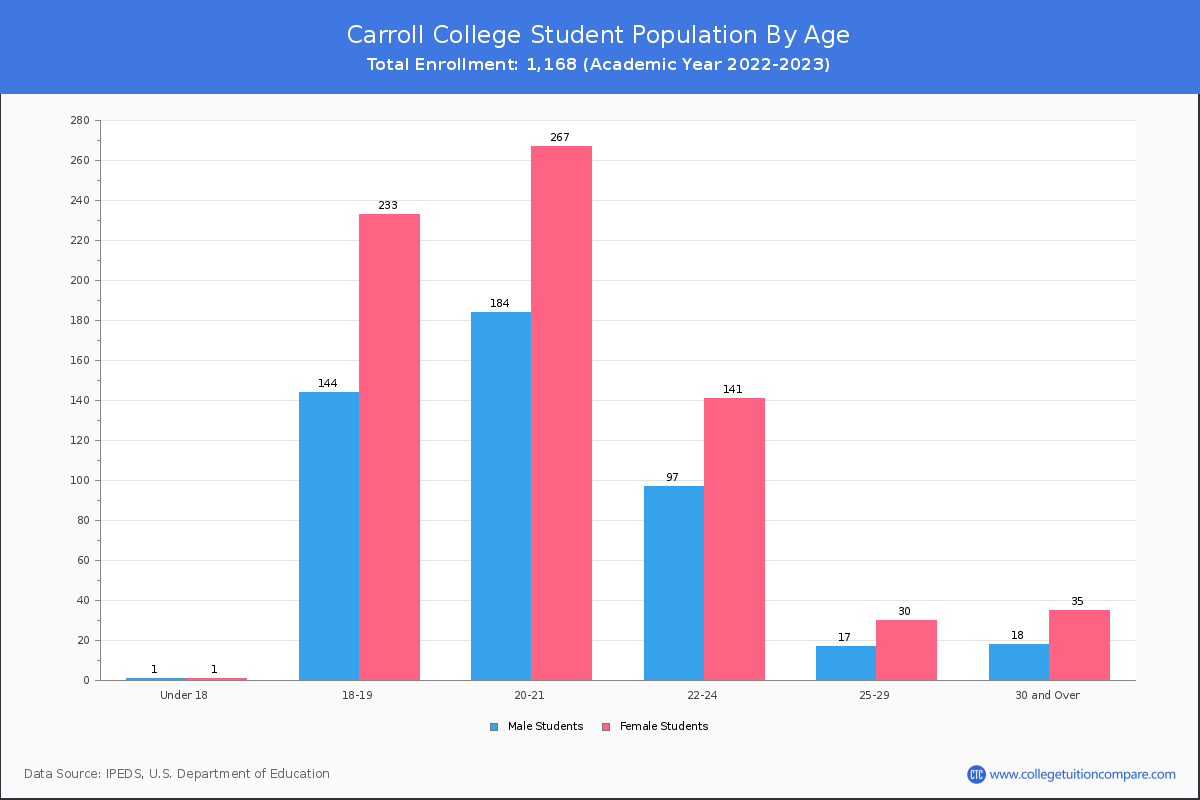
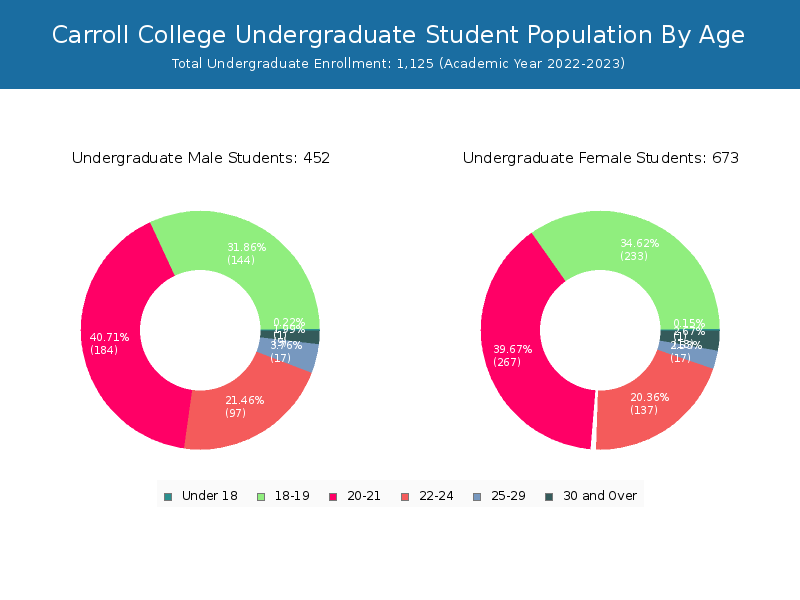
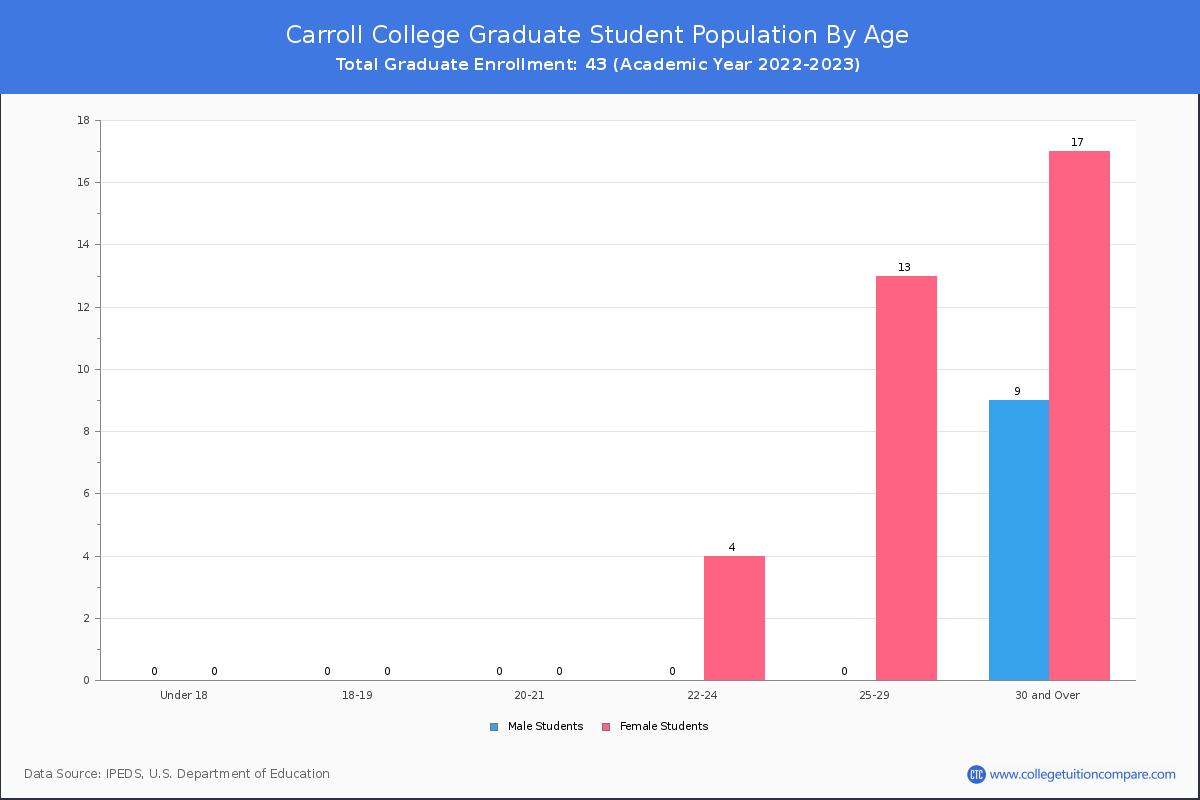
Student Age Distribution
By age, CC has 2 students under 18 years old and 1 students over 65 years old. There are 1,068 students under 25 years old, and 100 students over 25 years old out of 1,168 total students.
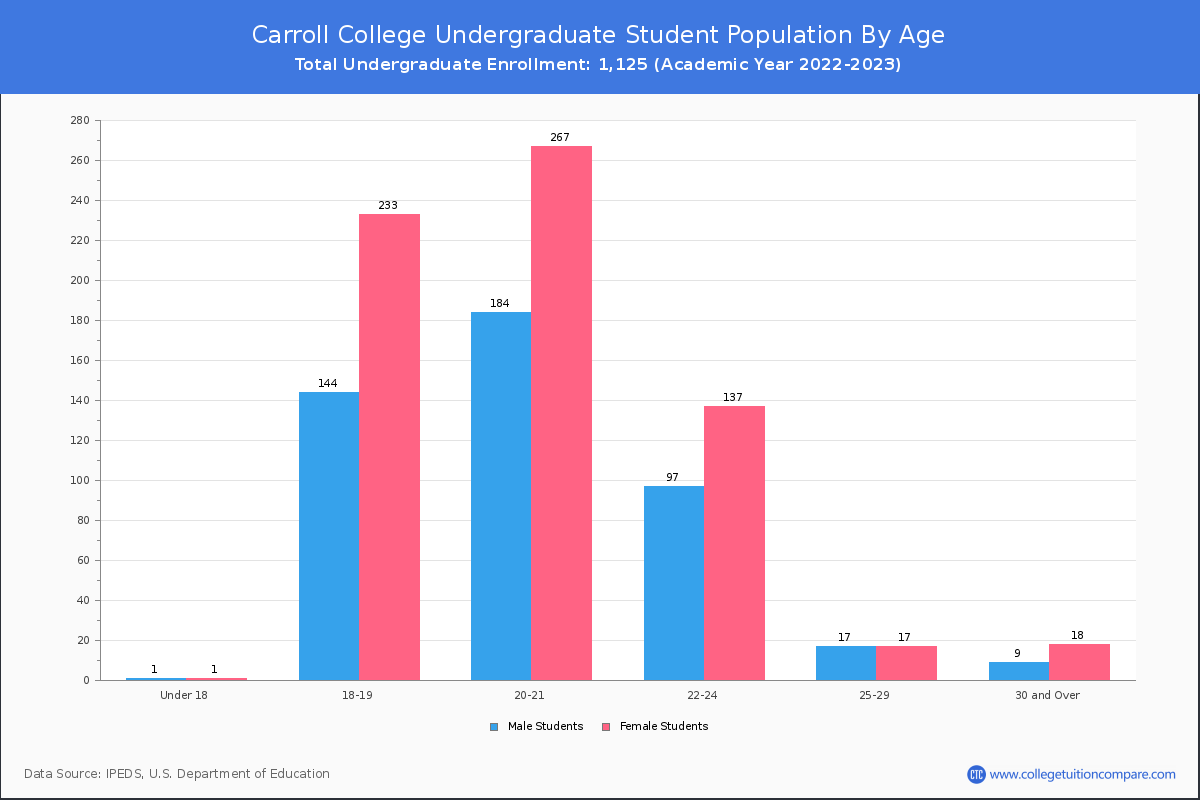
In undergraduate programs, 2 students are younger than 18 and 1 students are older than 65. CC has 1,064 undergraduate students aged under 25 and 61 students aged 25 and over.
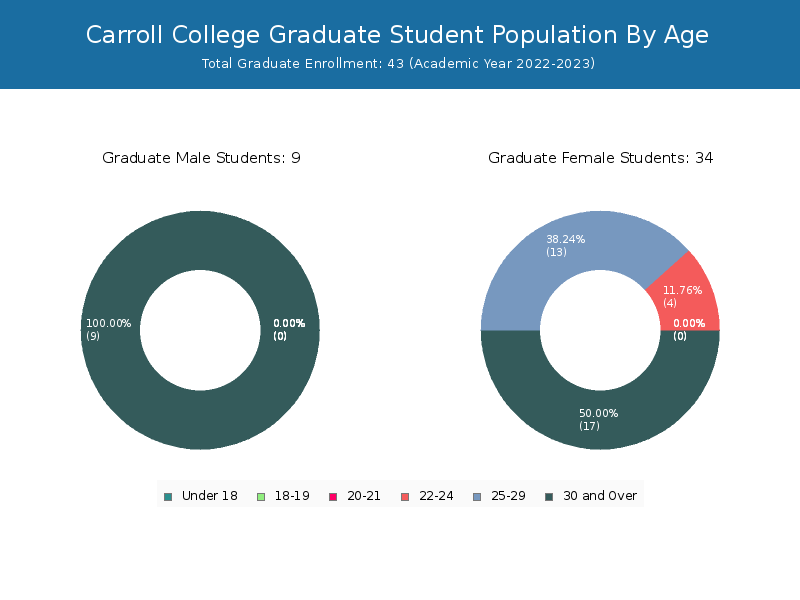
It has 4 graduate students aged under 25 and 39 students aged 25 and over.
| Age | Total | Men | Women |
|---|---|---|---|
| Under 18 | 2 | 1 | 1 |
| 18-19 | 377 | 233 | 144 |
| 20-21 | 451 | 267 | 184 |
| 22-24 | 238 | 141 | 97 |
| 25-29 | 47 | 30 | 17 |
| 30-34 | 21 | 16 | 5 |
| 35-39 | 10 | 6 | 4 |
| 40-49 | 15 | 7 | 8 |
| 50-64 | 6 | 5 | 1 |
| Over 65 | 1 | 1 | 0 |
| Age | Total | Men | Women |
|---|---|---|---|
| Under 18 | 2 | 1 | 1 |
| 18-19 | 377 | 233 | 144 |
| 20-21 | 451 | 267 | 184 |
| 22-24 | 234 | 137 | 97 |
| 25-29 | 34 | 17 | 17 |
| 30-34 | 13 | 9 | 4 |
| 35-39 | 4 | 2 | 2 |
| 40-49 | 7 | 4 | 3 |
| 50-64 | 2 | 2 | 0 |
| Over 65 | 1 | 1 | 0 |
| Age | Total | Men | Women |
|---|
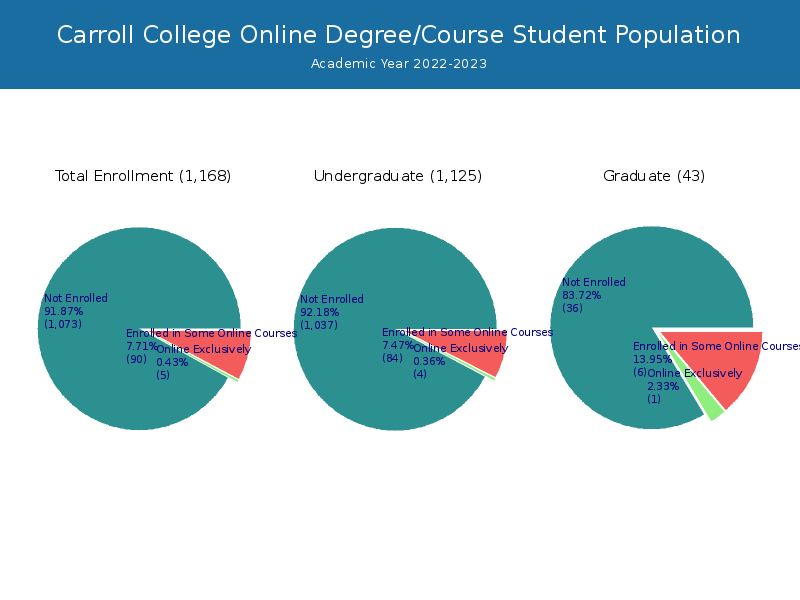
Online Student Enrollment
Distance learning, also called online education, is very attractive to students, especially who want to continue education and work in field. At Carroll College, 5 students are enrolled exclusively in online courses and 90 students are enrolled in some online courses.
4 students lived in Montana or jurisdiction in which the school is located are enrolled exclusively in online courses and 1 students live in other State or outside of the United States.
| All Students | Enrolled Exclusively Online Courses | Enrolled in Some Online Courses | |
|---|---|---|---|
| All Students | 1,168 | 5 | 90 |
| Undergraduate | 1,125 | 4 | 84 |
| Graduate | 43 | 1 | 6 |
| Montana Residents | Other States in U.S. | Outside of U.S. | |
|---|---|---|---|
| All Students | 4 | 1 | 0 |
| Undergraduate | 3 | 1 | 0 |
| Graduate | 1 | - | 0 |
Transfer-in Students (Undergraduate)
Among 1,125 enrolled in undergraduate programs, 44 students have transferred-in from other institutions. The percentage of transfer-in students is 3.91%.41 students have transferred in as full-time status and 3 students transferred in as part-time status.
| Number of Students | |
|---|---|
| Regular Full-time | 1,058 |
| Transfer-in Full-time | 41 |
| Regular Part-time | 23 |
| Transfer-in Part-time | 3 |