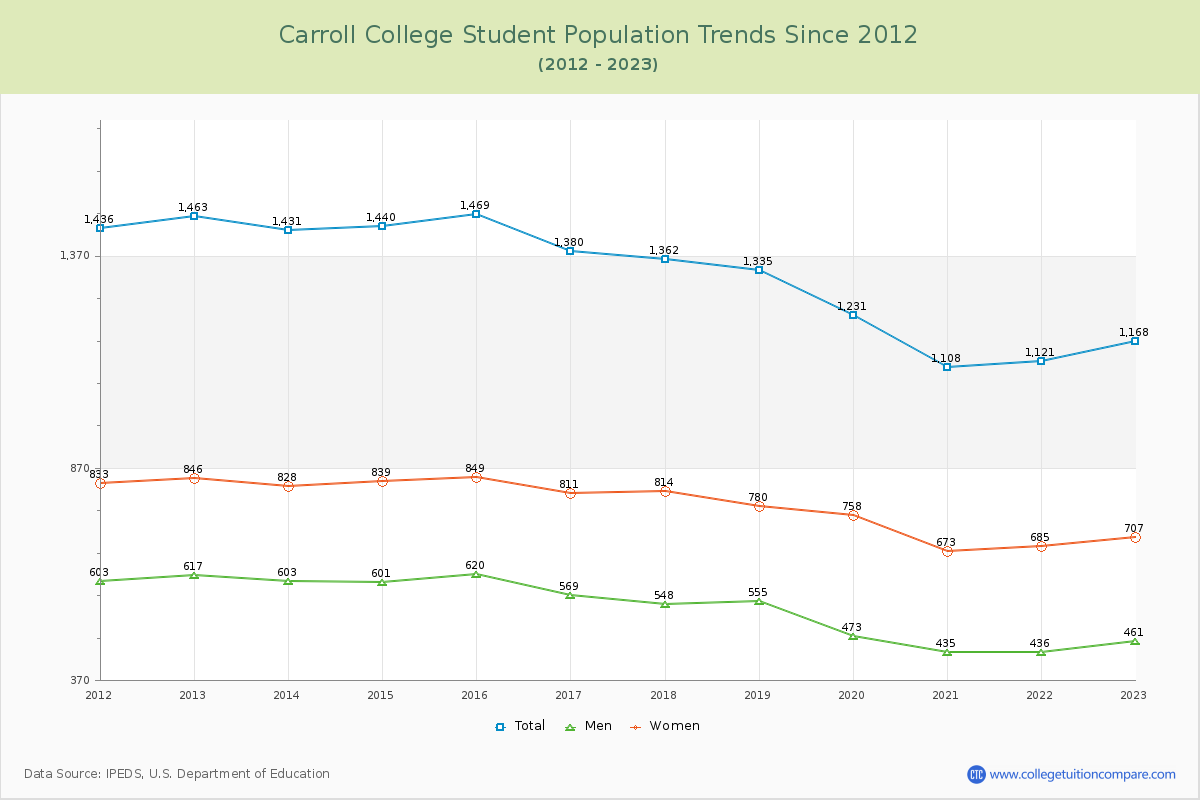
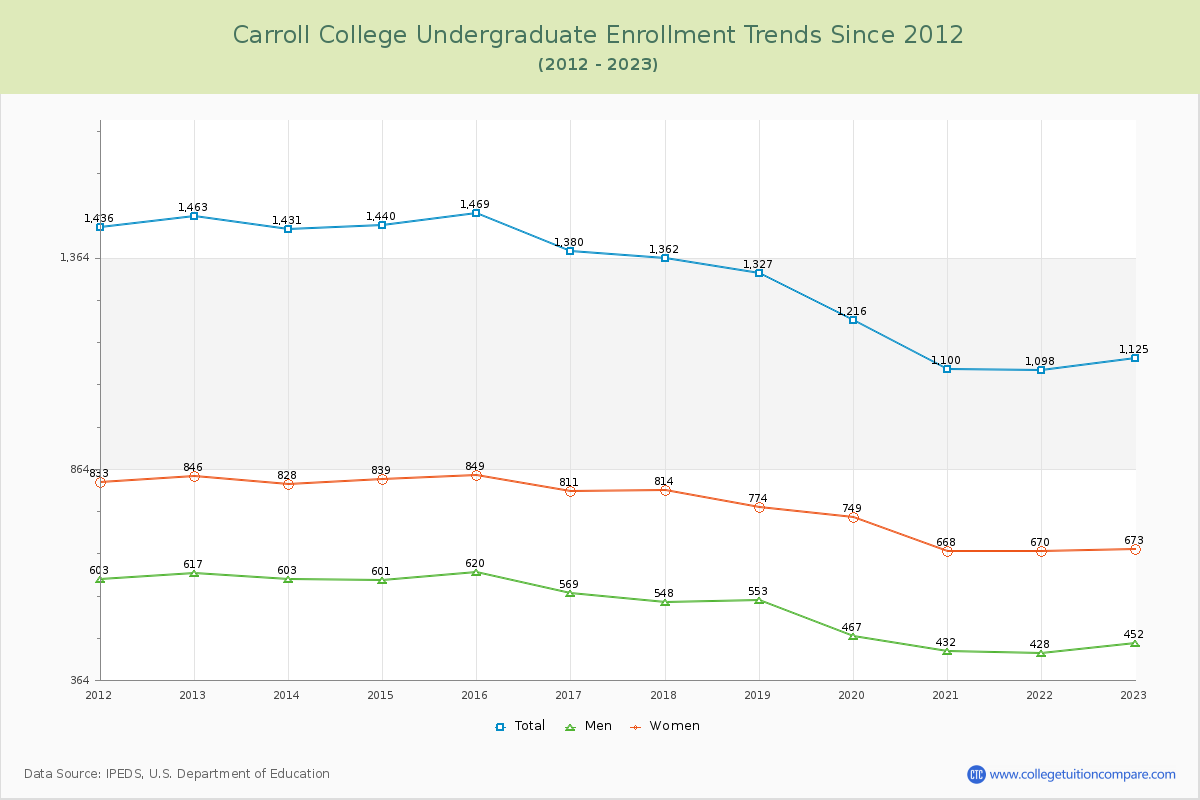
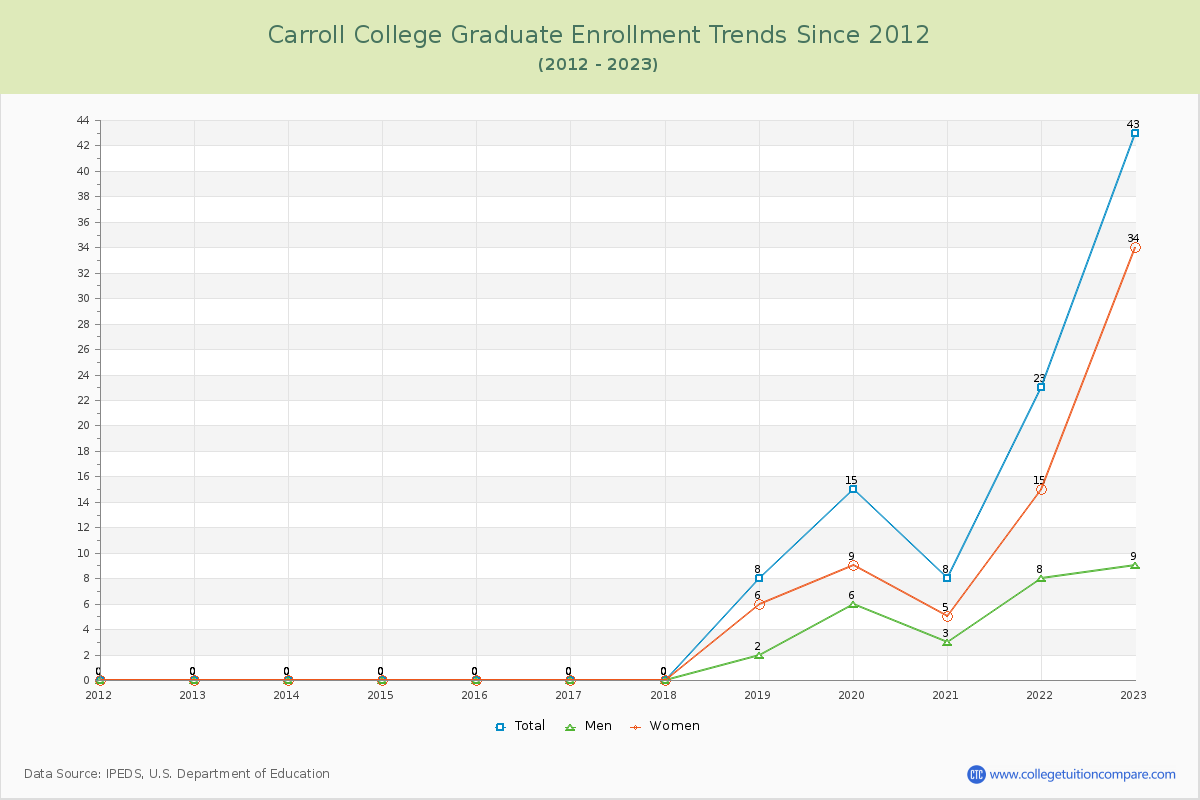
Student Population Changes
The average student population over the last 12 years is 1,319 where 1,168 students are attending the school for the academic year 2022-2023.
96.32% of total students is undergraduate students and 3.68% students is graduate students. The number of undergraduate students has decreased by 338 and the graduate enrollment has increased by 43 over past 10 years.
The female to male ratio is 1.53 to 1 and it means that there are more female students enrolled in CC than male students.
The following table and chart illustrate the changes in student population by gender at Carroll College since 2012.
| Year | Total | Undergraduate | Graduate | ||||
|---|---|---|---|---|---|---|---|
| Total | Men | Women | Total | Men | Women | ||
| 2012-13 | 1,463 | 1,463 | 617 | 846 | 0 | 0 | 0 |
| 2013-14 | 1,431 -32 | 1,431 -32 | 603 -14 | 828 -18 | 0 0 | 0 0 | 0 0 |
| 2014-15 | 1,440 9 | 1,440 9 | 601 -2 | 839 11 | 0 0 | 0 0 | 0 0 |
| 2015-16 | 1,469 29 | 1,469 29 | 620 19 | 849 10 | 0 0 | 0 0 | 0 0 |
| 2016-17 | 1,380 -89 | 1,380 -89 | 569 -51 | 811 -38 | 0 0 | 0 0 | 0 0 |
| 2017-18 | 1,362 -18 | 1,362 -18 | 548 -21 | 814 3 | 0 0 | 0 0 | 0 0 |
| 2018-19 | 1,335 -27 | 1,327 -35 | 553 5 | 774 -40 | 8 8 | 2 2 | 6 6 |
| 2019-20 | 1,231 -104 | 1,216 -111 | 467 -86 | 749 -25 | 15 7 | 6 4 | 9 3 |
| 2020-21 | 1,108 -123 | 1,100 -116 | 432 -35 | 668 -81 | 8 -7 | 3 -3 | 5 -4 |
| 2021-22 | 1,121 13 | 1,098 -2 | 428 -4 | 670 2 | 23 15 | 8 5 | 15 10 |
| 2022-23 | 1,168 47 | 1,125 27 | 452 24 | 673 3 | 43 20 | 9 1 | 34 19 |
| Average | 1,319 | 1,310 | 535 | 775 | 9 | 3 | 6 |