Student Population by Gender
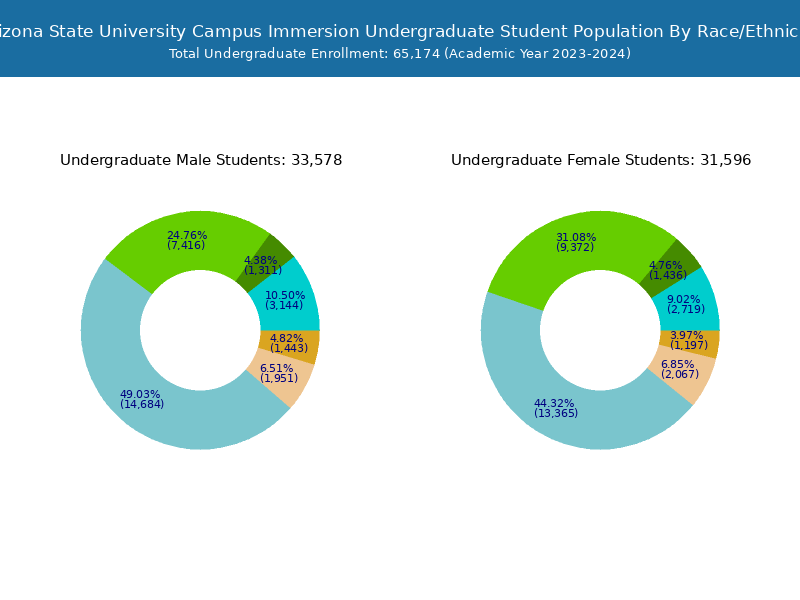
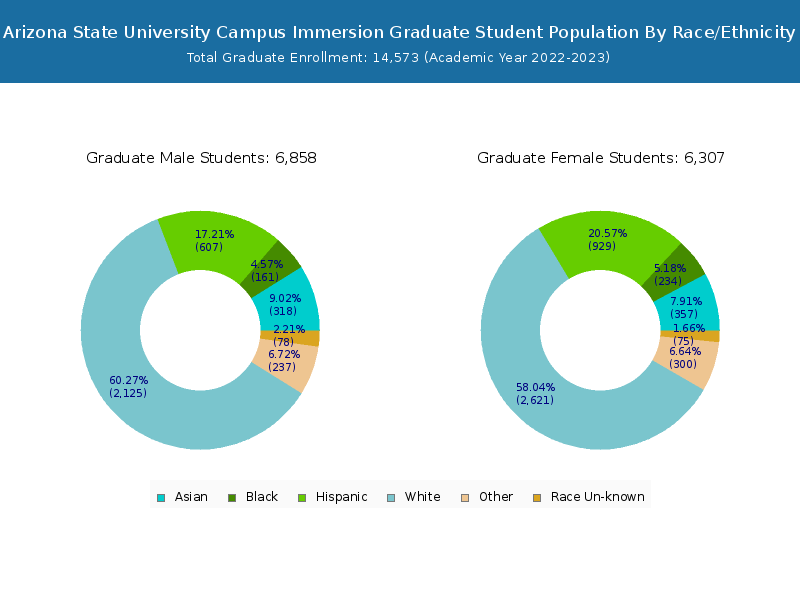
Arizona State University Campus Immersion has a total of 80,065 enrolled students for the academic year 2022-2023. 65,492 students have enrolled in undergraduate programs and 14,573 students joined graduate programs.
By gender, 41,414 male and 38,651 female students (the male-female ratio is 52:48) are attending the school. The gender distribution is based on the 2022-2023 data.
| Total | Undergraduate | Graduate | |
|---|---|---|---|
| Total | 80,065 | 65,492 | 14,573 |
| Men | 41,414 | 33,351 | 8,063 |
| Women | 38,651 | 32,141 | 6,510 |
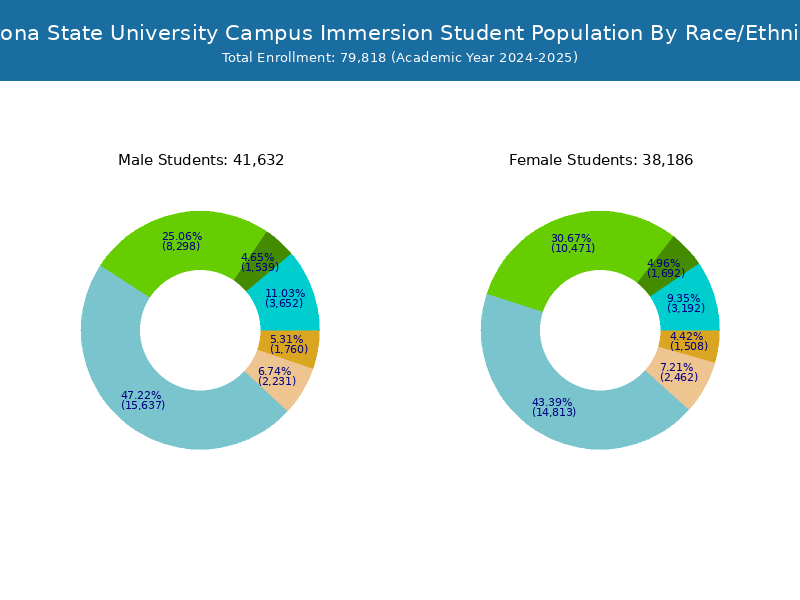
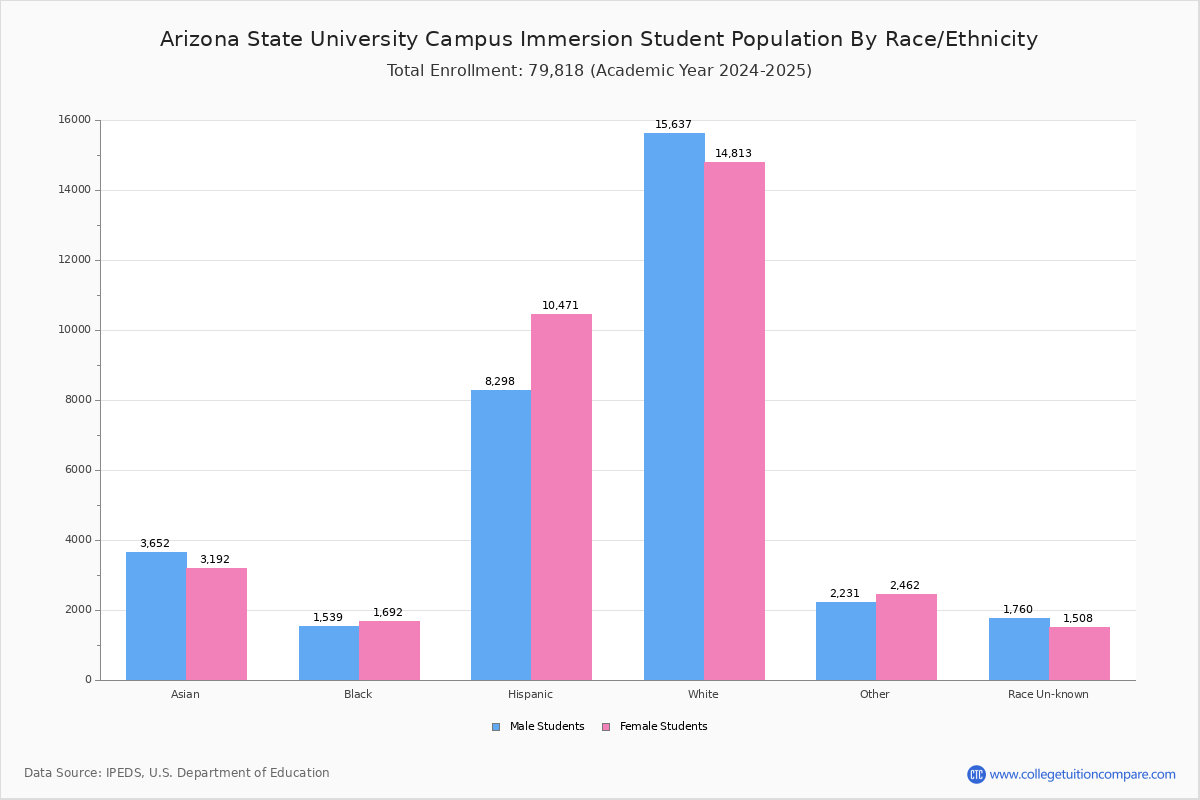
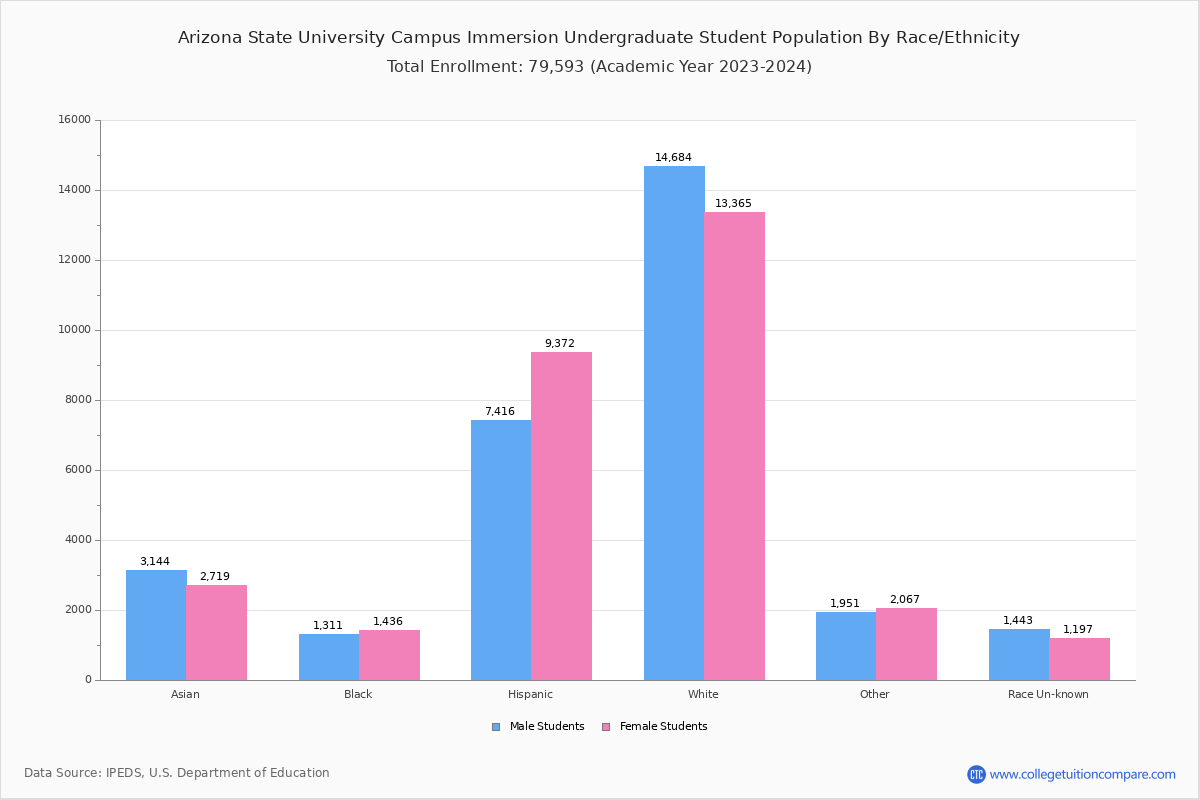
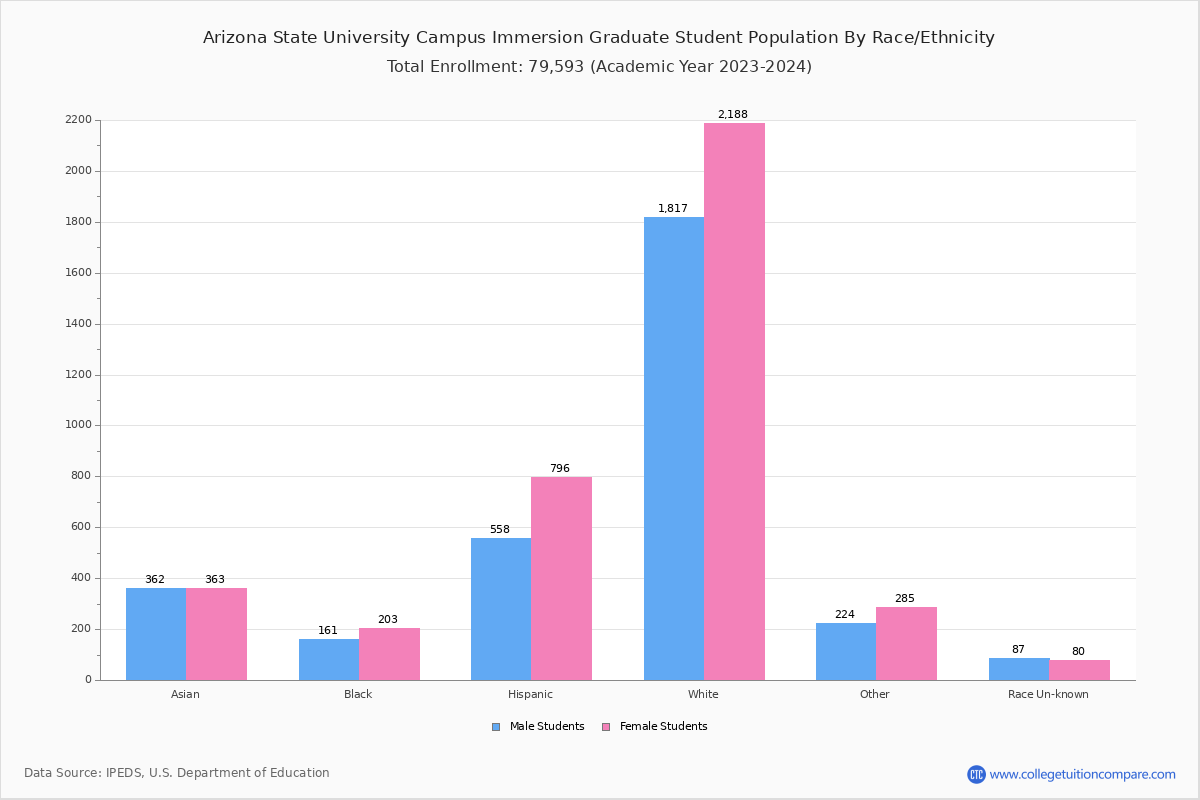
Student Distribution by Race/Ethnicity
By race/ethnicity, 33,561 White, 3,148 Black, and 6,366 Asian students out of a total of 80,065 are attending at Arizona State University Campus Immersion. Comprehensive enrollment statistic data by race/ethnicity is shown in the next chart (Academic year 2022-2023 data).
| Race | Total | Men | Women |
|---|---|---|---|
| American Indian or Native American | 859 | 350 | 509 |
| Asian | 6,366 | 3,357 | 3,009 |
| Black | 3,148 | 1,457 | 1,691 |
| Hispanic | 18,272 | 8,018 | 10,254 |
| Native Hawaiian or Other Pacific Islanders | 158 | 80 | 78 |
| White | 33,561 | 17,080 | 16,481 |
| Two or more races | 3,635 | 1,775 | 1,860 |
| Race Unknown | 2,458 | 1,328 | 1,130 |
| Race | Total | Men | Women |
|---|---|---|---|
| American Indian or Native American | 725 | 306 | 419 |
| Asian | 5,689 | 3,049 | 2,640 |
| Black | 2,784 | 1,314 | 1,470 |
| Hispanic | 16,843 | 7,418 | 9,425 |
| Native Hawaiian or Other Pacific Islanders | 136 | 70 | 66 |
| White | 29,298 | 15,170 | 14,128 |
| Two or more races | 3,282 | 1,611 | 1,671 |
| Race Unknown | 2,306 | 1,253 | 1,053 |
| Race | Total | Men | Women |
|---|---|---|---|
| American Indian or Native American | 76 | 21 | 55 |
| Asian | 206 | 107 | 99 |
| Black | 211 | 103 | 108 |
| Hispanic | 1,089 | 493 | 596 |
| Native Hawaiian or Other Pacific Islanders | 8 | 7 | 1 |
| White | 1,922 | 978 | 944 |
| Two or more races | 191 | 108 | 83 |
| Race Unknown | 141 | 78 | 63 |
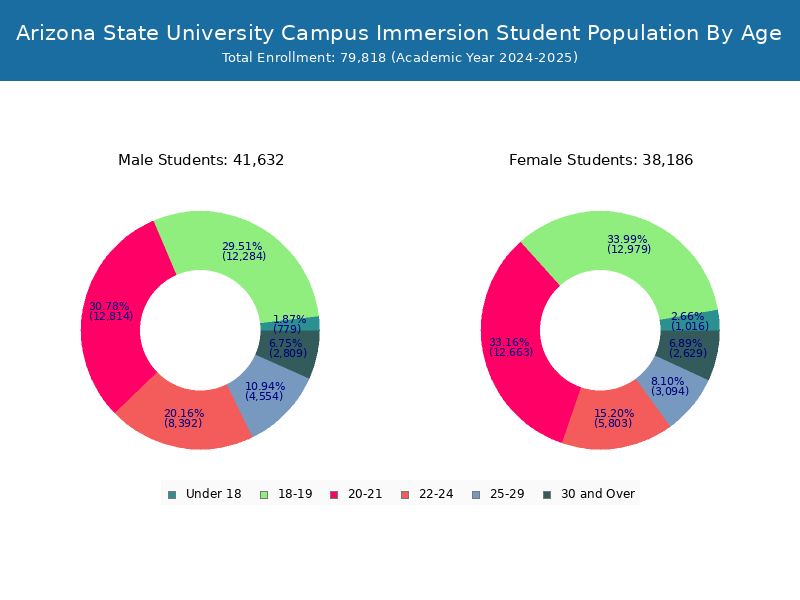
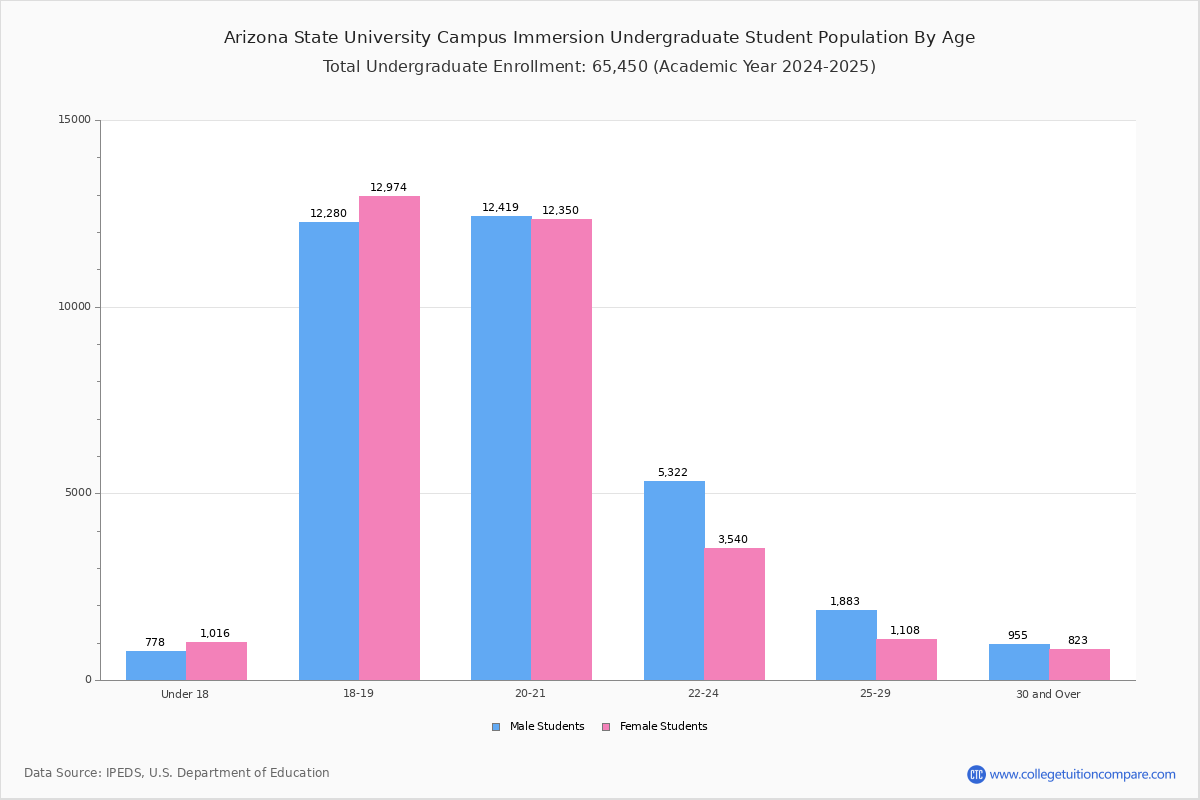
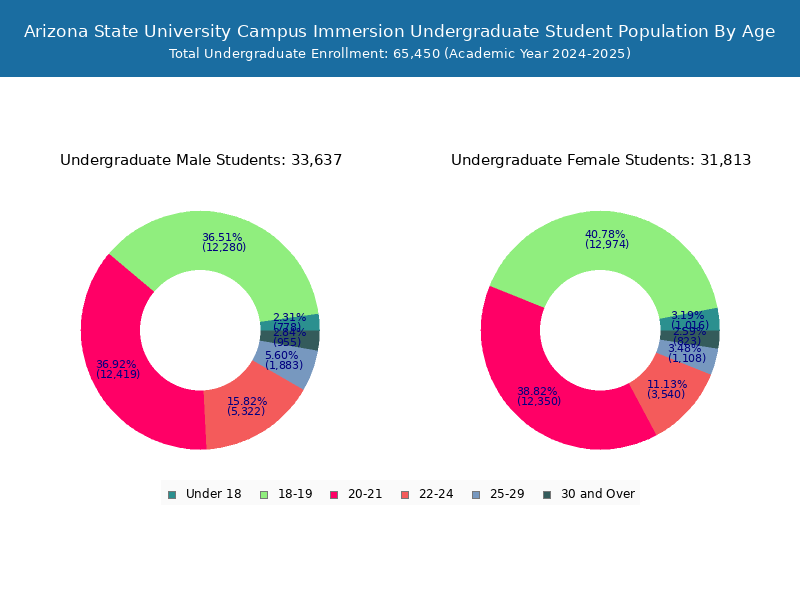
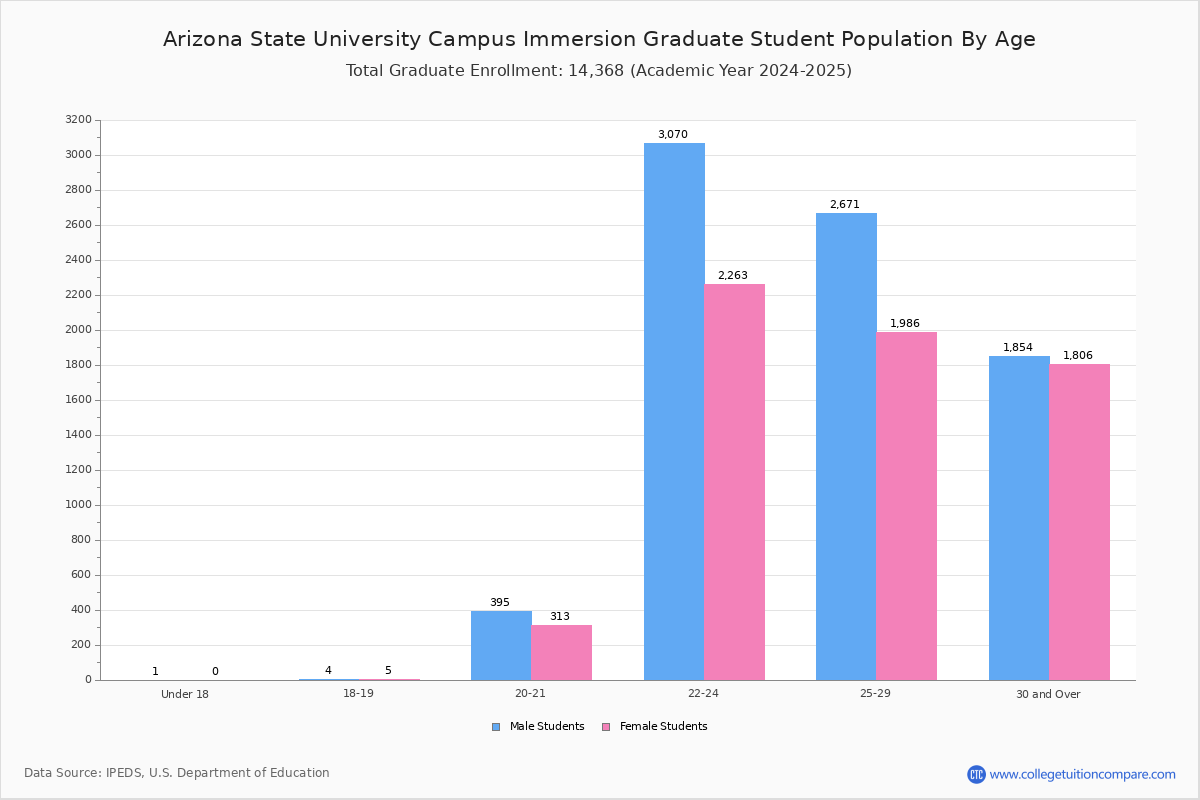
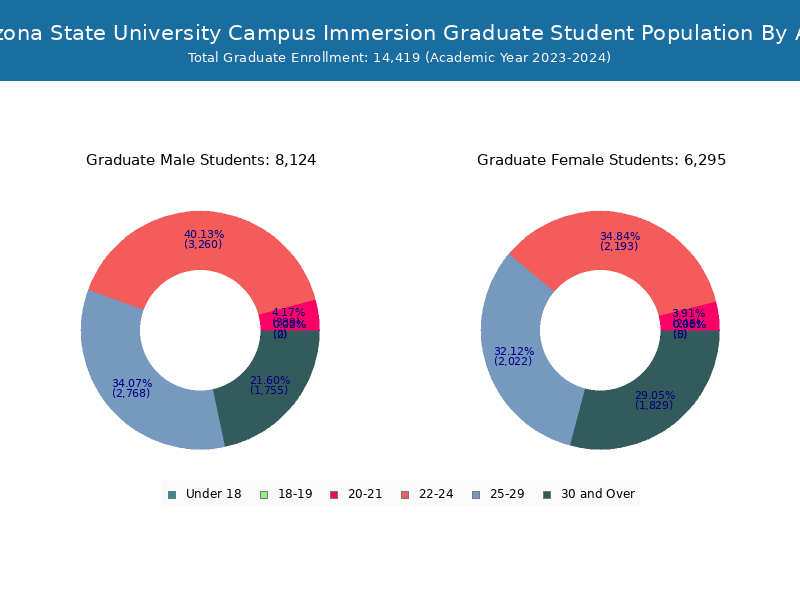
Student Age Distribution
By age, ASU Tempe has 1,810 students under 18 years old and 47 students over 65 years old. There are 66,323 students under 25 years old, and 13,737 students over 25 years old out of 80,065 total students.
In undergraduate programs, 1,807 students are younger than 18 and 13 students are older than 65. ASU Tempe has 60,061 undergraduate students aged under 25 and 5,426 students aged 25 and over.
In graduate schools at ASU Tempe, 3 students are younger than 18 and 34 students are older than 65. It has 6,262 graduate students aged under 25 and 8,311 students aged 25 and over.
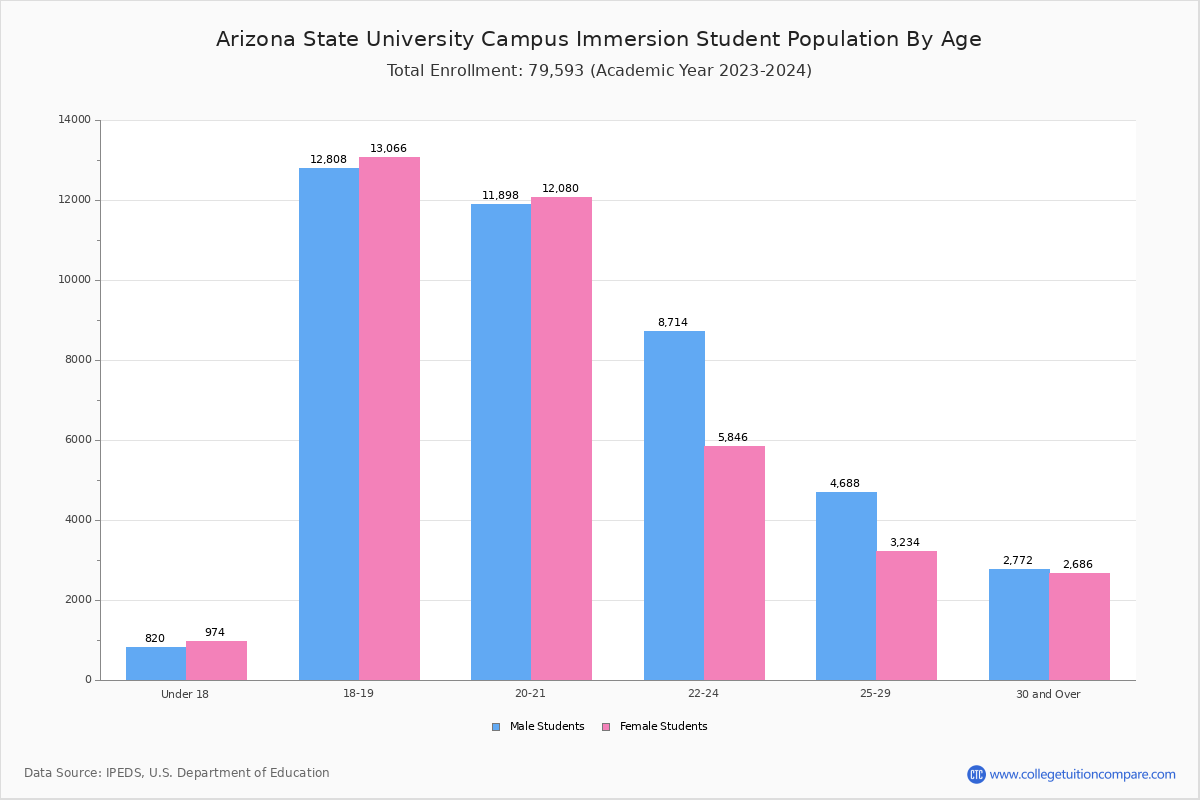
| Age | Total | Men | Women |
|---|---|---|---|
| Under 18 | 1,810 | 972 | 838 |
| 18-19 | 26,036 | 13,342 | 12,694 |
| 20-21 | 23,703 | 12,060 | 11,643 |
| 22-24 | 14,774 | 6,013 | 8,761 |
| 25-29 | 8,135 | 3,447 | 4,688 |
| 30-34 | 2,753 | 1,246 | 1,507 |
| 35-39 | 1,210 | 609 | 601 |
| 40-49 | 1,146 | 664 | 482 |
| 50-64 | 446 | 268 | 178 |
| Over 65 | 47 | 28 | 19 |
| Age | Total | Men | Women |
|---|---|---|---|
| Under 18 | 1,807 | 970 | 837 |
| 18-19 | 26,033 | 13,339 | 12,694 |
| 20-21 | 23,072 | 11,794 | 11,278 |
| 22-24 | 9,149 | 3,688 | 5,461 |
| 25-29 | 3,329 | 1,338 | 1,991 |
| 30-34 | 1,043 | 440 | 603 |
| 35-39 | 468 | 230 | 238 |
| 40-49 | 430 | 252 | 178 |
| 50-64 | 143 | 84 | 59 |
| Over 65 | 13 | 4 | 9 |
| Age | Total | Men | Women |
|---|---|---|---|
| Under 18 | 3 | 2 | 1 |
| 18-19 | 3 | 3 | 0 |
| 20-21 | 631 | 266 | 365 |
| 22-24 | 5,625 | 2,325 | 3,300 |
| 25-29 | 4,806 | 2,109 | 2,697 |
| 30-34 | 1,710 | 806 | 904 |
| 35-39 | 742 | 379 | 363 |
| 40-49 | 716 | 412 | 304 |
| 50-64 | 303 | 184 | 119 |
| Over 65 | 34 | 24 | 10 |
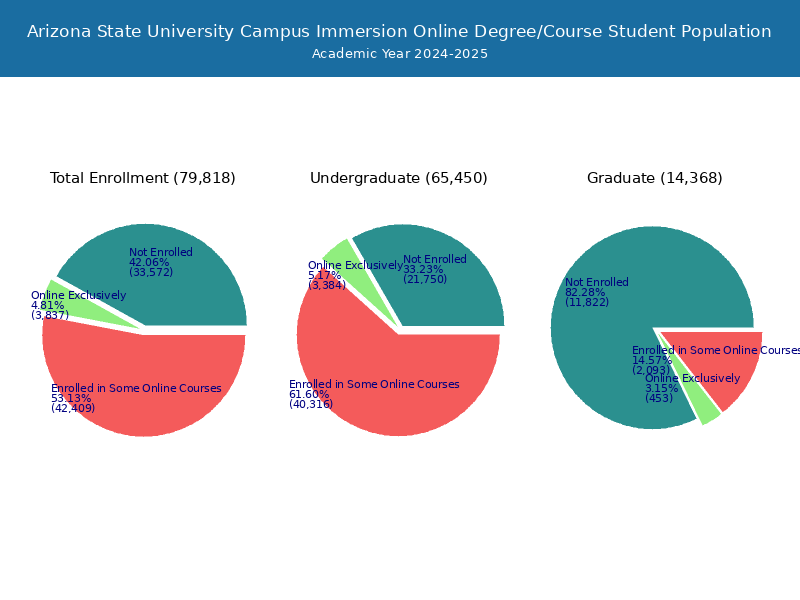
Online Student Enrollment
Distance learning, also called online education, is very attractive to students, especially who want to continue education and work in field. At Arizona State University Campus Immersion, 4,395 students are enrolled exclusively in online courses and 40,613 students are enrolled in some online courses.
3,902 students lived in Arizona or jurisdiction in which the school is located are enrolled exclusively in online courses and 493 students live in other State or outside of the United States.
| All Students | Enrolled Exclusively Online Courses | Enrolled in Some Online Courses | |
|---|---|---|---|
| All Students | 80,065 | 4,395 | 40,613 |
| Undergraduate | 65,492 | 3,958 | 38,222 |
| Graduate | 14,573 | 437 | 2,391 |
| Arizona Residents | Other States in U.S. | Outside of U.S. | |
|---|---|---|---|
| All Students | 3,902 | 402 | 91 |
| Undergraduate | 3,530 | 342 | 86 |
| Graduate | 372 | 60 | 5 |
Transfer-in Students (Undergraduate)
Among 65,492 enrolled in undergraduate programs, 4,087 students have transferred-in from other institutions. The percentage of transfer-in students is 6.24%.3,506 students have transferred in as full-time status and 581 students transferred in as part-time status.
| Number of Students | |
|---|---|
| Regular Full-time | 56,378 |
| Transfer-in Full-time | 3,506 |
| Regular Part-time | 5,027 |
| Transfer-in Part-time | 581 |