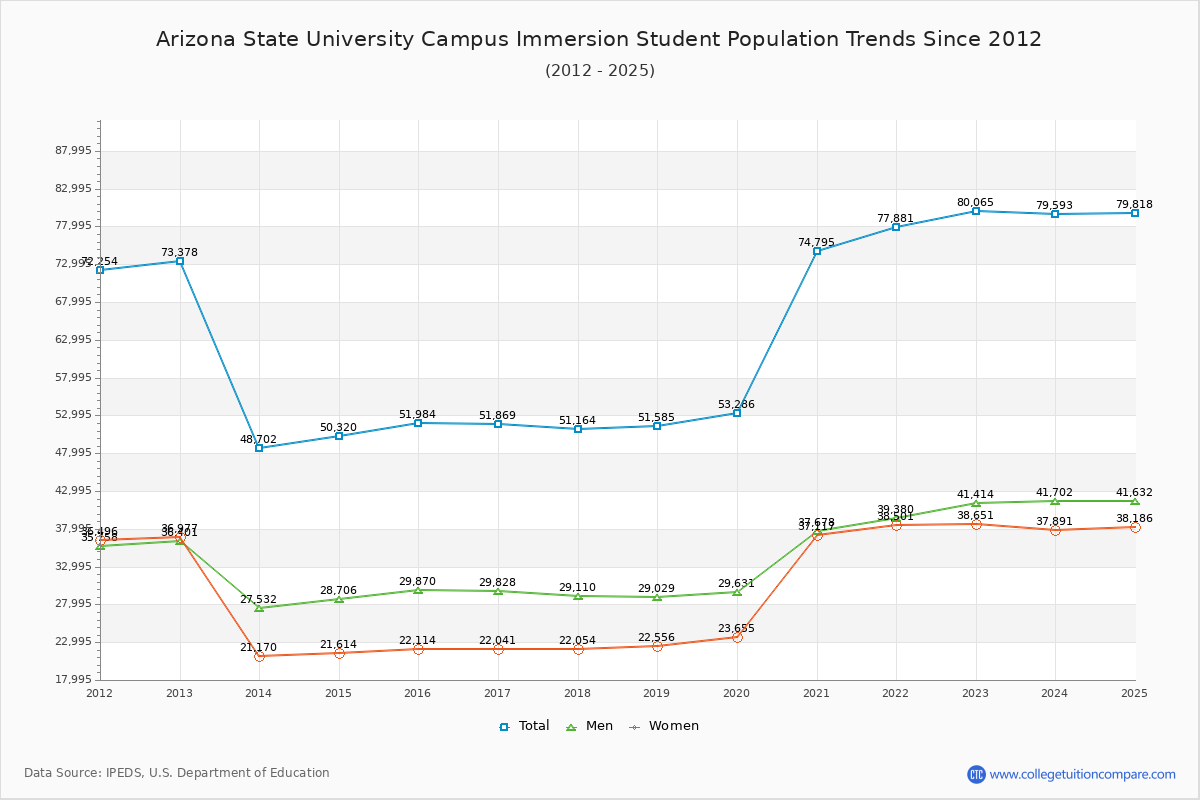
Student Population Changes
The average student population over the last 12 years is 60,457 where 80,065 students are attending the school for the academic year 2022-2023.
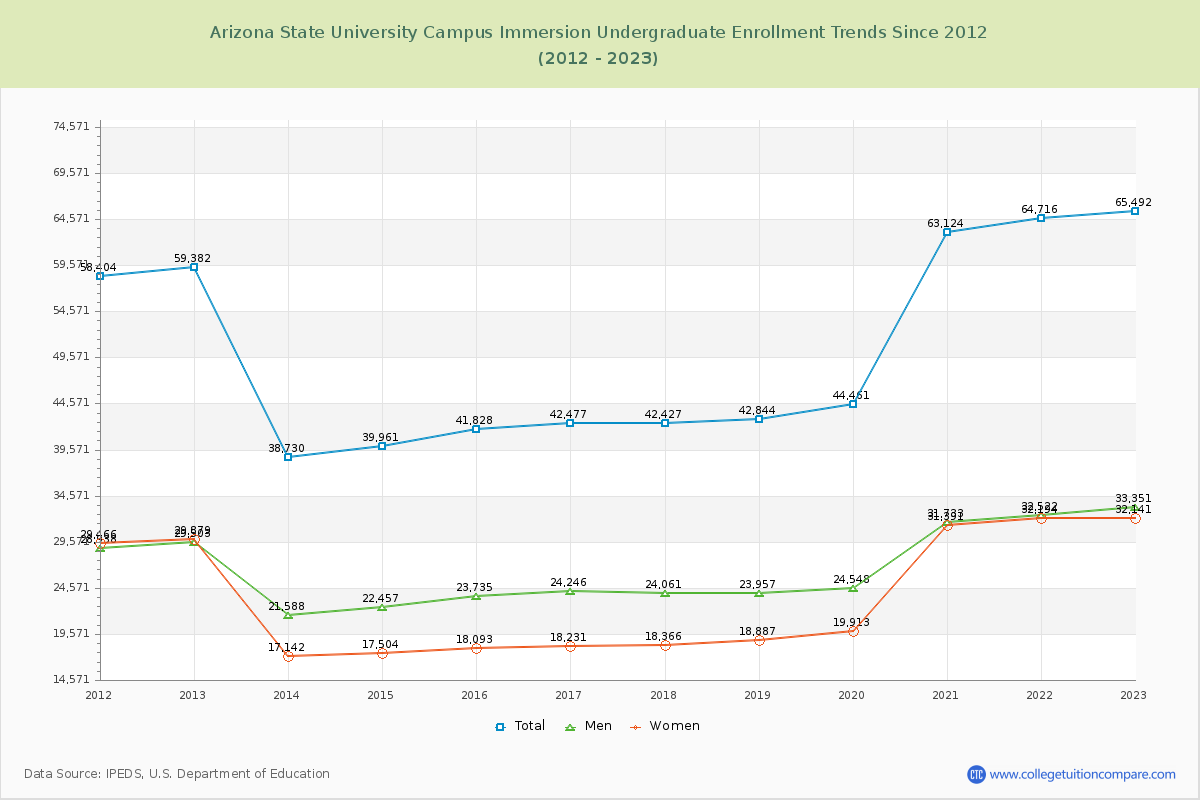
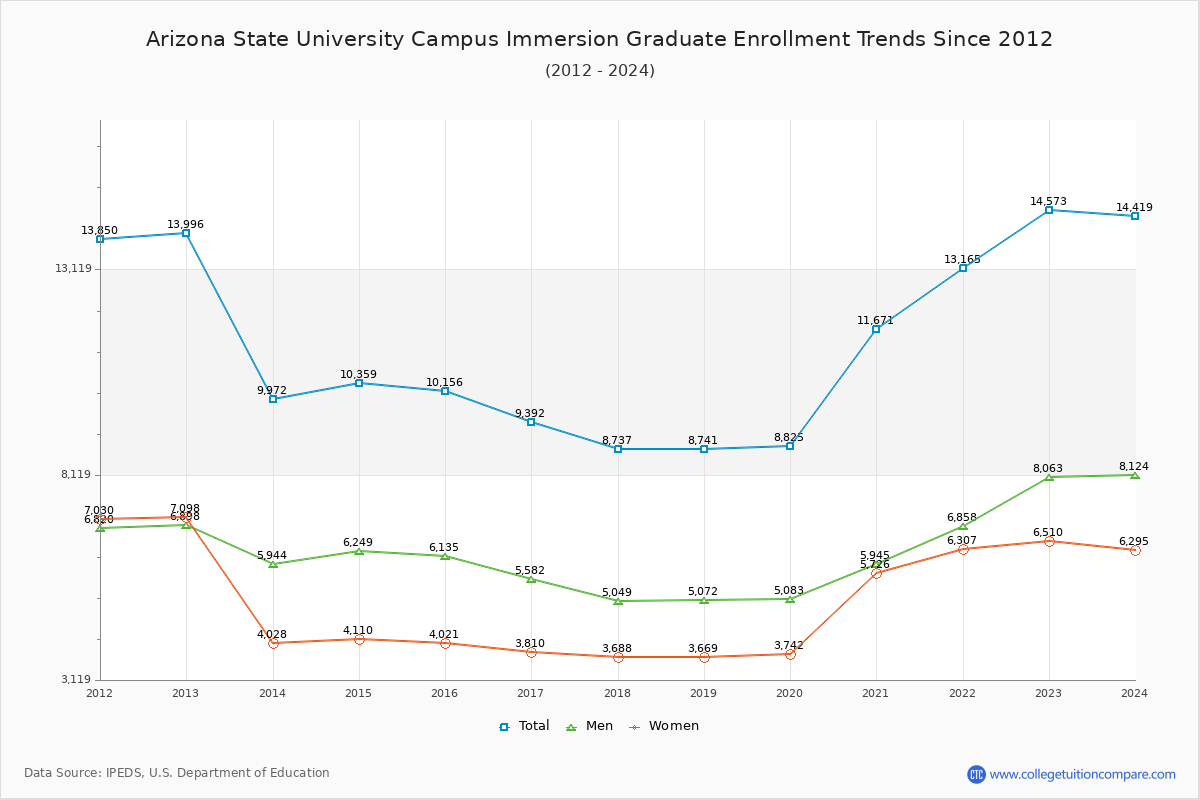
81.80% of total students is undergraduate students and 18.20% students is graduate students. The number of undergraduate students has increased by 6,110 and the graduate enrollment has increased by 577 over past 10 years.
The female to male ratio is 0.93 to 1 and it means that there are similar numbers of female and male students enrolled in ASU Tempe.
The following table and chart illustrate the changes in student population by gender at Arizona State University Campus Immersion since 2012.
| Year | Total | Undergraduate | Graduate | ||||
|---|---|---|---|---|---|---|---|
| Total | Men | Women | Total | Men | Women | ||
| 2012-13 | 73,378 | 59,382 | 29,503 | 29,879 | 13,996 | 6,898 | 7,098 |
| 2013-14 | 48,702 -24,676 | 38,730 -20,652 | 21,588 -7,915 | 17,142 -12,737 | 9,972 -4,024 | 5,944 -954 | 4,028 -3,070 |
| 2014-15 | 50,320 1,618 | 39,961 1,231 | 22,457 869 | 17,504 362 | 10,359 387 | 6,249 305 | 4,110 82 |
| 2015-16 | 51,984 1,664 | 41,828 1,867 | 23,735 1,278 | 18,093 589 | 10,156 -203 | 6,135 -114 | 4,021 -89 |
| 2016-17 | 51,869 -115 | 42,477 649 | 24,246 511 | 18,231 138 | 9,392 -764 | 5,582 -553 | 3,810 -211 |
| 2017-18 | 51,164 -705 | 42,427 -50 | 24,061 -185 | 18,366 135 | 8,737 -655 | 5,049 -533 | 3,688 -122 |
| 2018-19 | 51,585 421 | 42,844 417 | 23,957 -104 | 18,887 521 | 8,741 4 | 5,072 23 | 3,669 -19 |
| 2019-20 | 53,286 1,701 | 44,461 1,617 | 24,548 591 | 19,913 1,026 | 8,825 84 | 5,083 11 | 3,742 73 |
| 2020-21 | 74,795 21,509 | 63,124 18,663 | 31,733 7,185 | 31,391 11,478 | 11,671 2,846 | 5,945 862 | 5,726 1,984 |
| 2021-22 | 77,881 3,086 | 64,716 1,592 | 32,522 789 | 32,194 803 | 13,165 1,494 | 6,858 913 | 6,307 581 |
| 2022-23 | 80,065 2,184 | 65,492 776 | 33,351 829 | 32,141 -53 | 14,573 1,408 | 8,063 1,205 | 6,510 203 |
| Average | 60,457 | 49,586 | 26,518 | 23,067 | 10,872 | 6,080 | 4,792 |