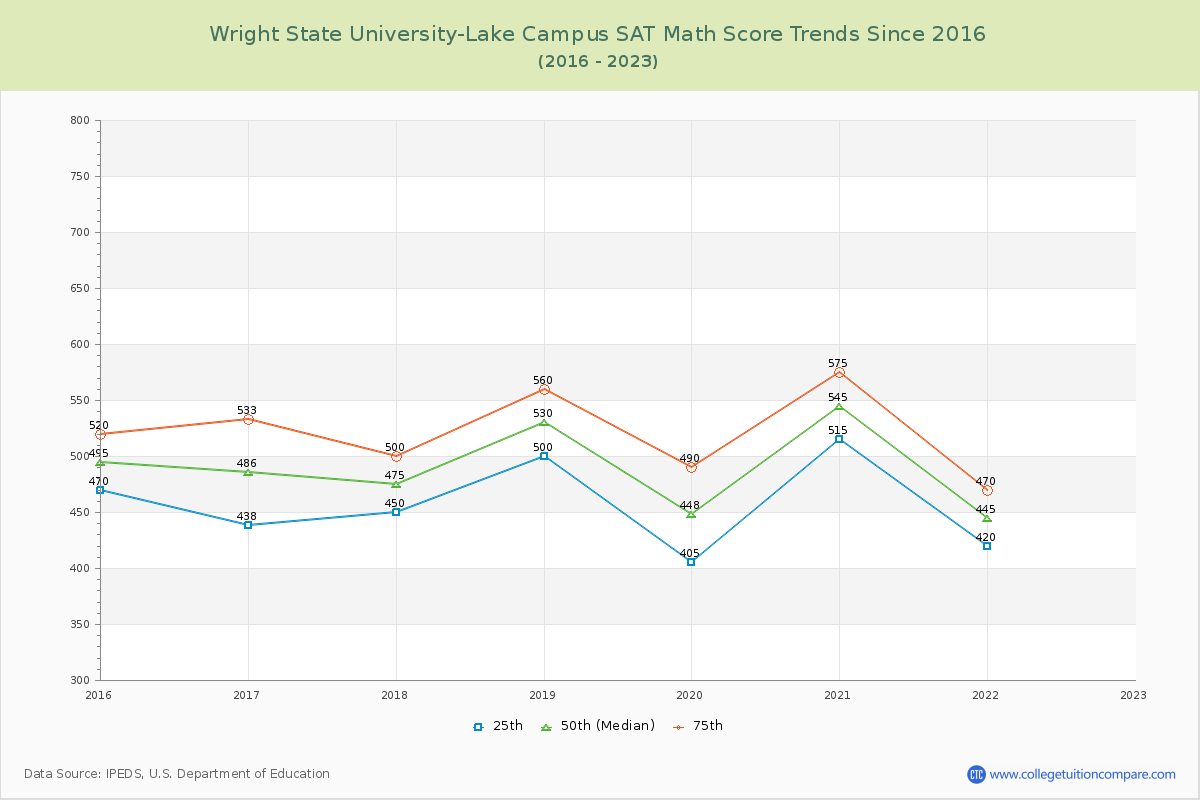
SAT Scores Over Time
The 2023 SAT score is at Wright State University-Lake Campus. Over the past 9 years, the average SAT score is 894 (25th percentile) and 1030 (75th percentile). Compared to similar schools, the submitted SAT scores are around national average at Wright State University-Lake Campus.
The following table and chart illustrate the changes in SAT scores at Wright State University-Lake Campus since 2015.
| Year | Total | Math | Evidence-Based Reading and Writing | ||||||
|---|---|---|---|---|---|---|---|---|---|
| 25th | 50th | 75th | 25th | 50th | 75th | 25th | 50th | 75th | |
| 2015-16 | 870 | 935 | 1,000 | 470 | 495 | 520 | 400 | 440 | 480 |
| 2016-17 | 851 | 921 | 991 | 438 | 486 | 533 | 413 | 436 | 458 |
| 2017-18 | 930 | 980 | 1,030 | 450 | 475 | 500 | 480 | 505 | 530 |
| 2018-19 | 970 | 1,045 | 1,120 | 500 | 530 | 560 | 470 | 515 | 560 |
| 2019-20 | 865 | 928 | 990 | 405 | 448 | 490 | 460 | 480 | 500 |
| 2020-21 | 980 | 1,085 | 1,190 | 515 | 545 | 575 | 465 | 540 | 615 |
| 2021-22 | 790 | 840 | 890 | 420 | 445 | 470 | 370 | 395 | 420 |
| 2022-23 | - | - | - | - | - | - | - | - | - |
| Average | 894 | 962 | 1030 | 457 | 489 | 521 | 437 | 473 | 509 |
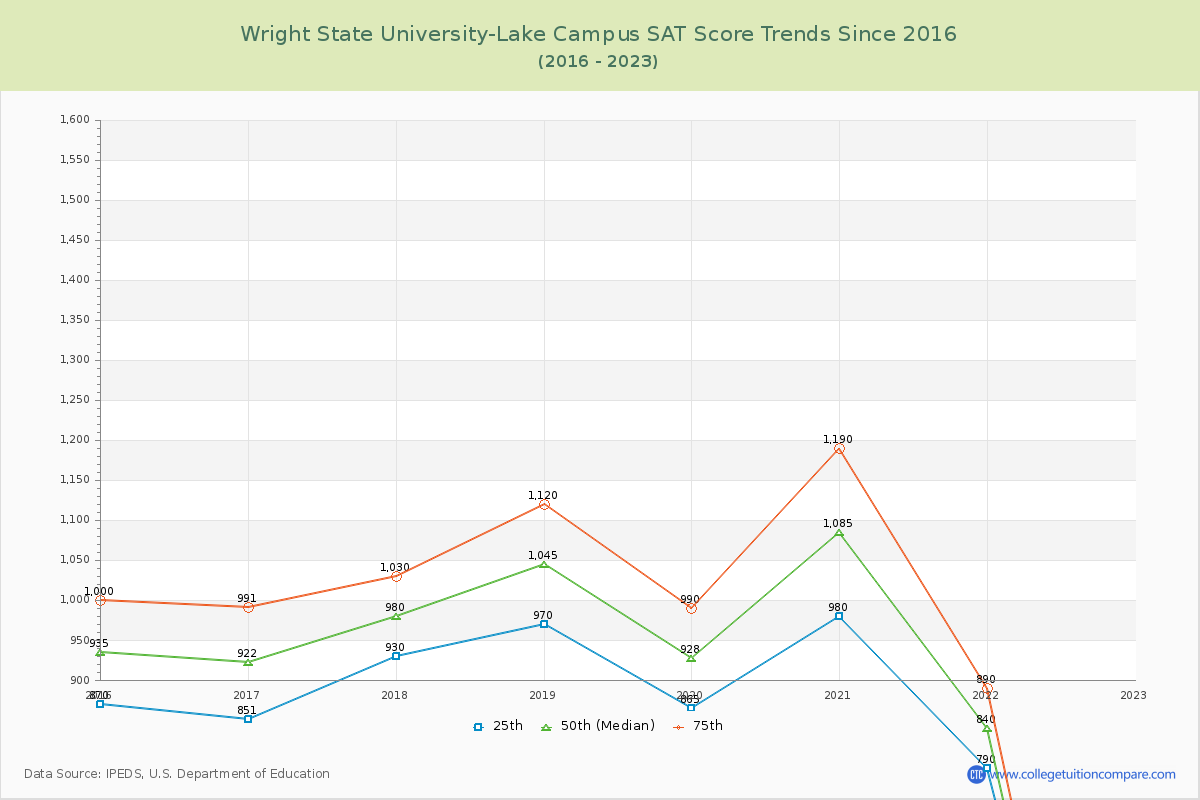
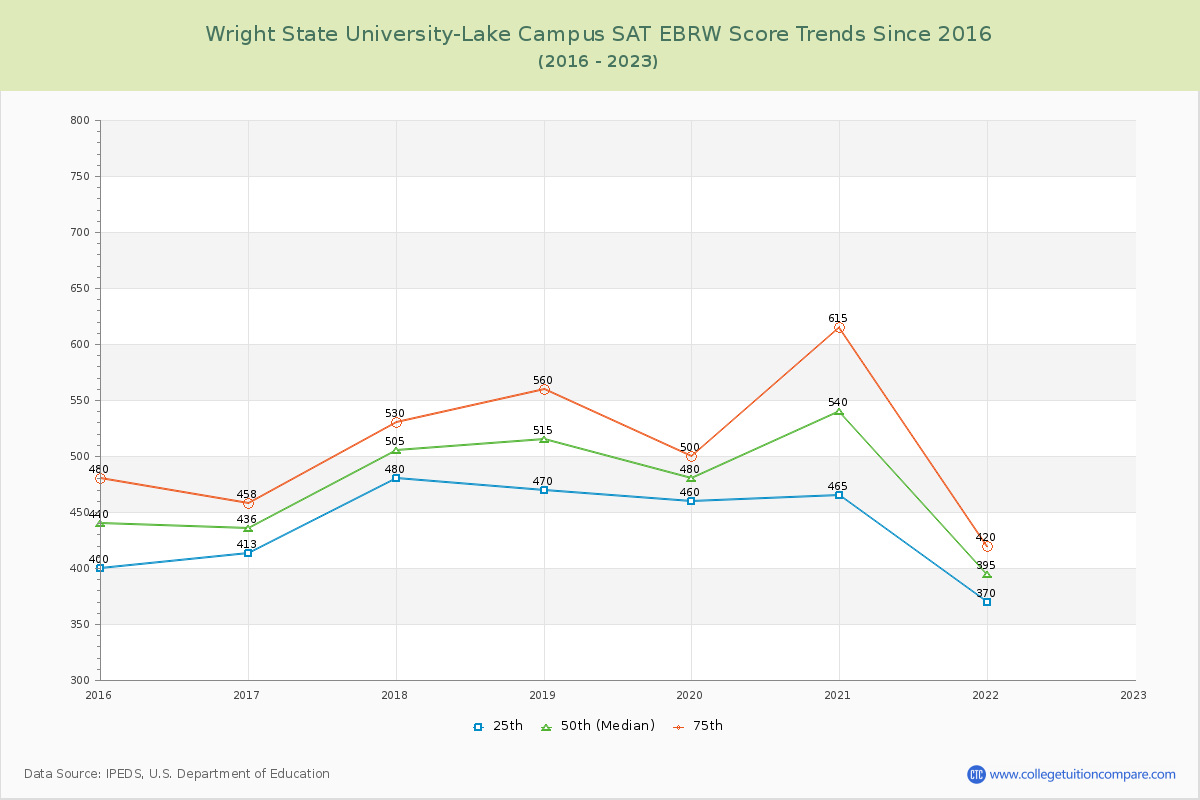
*SAT Evidence-Based Reading and Writing replaces SAT critical reading and writing since year 2017.
**The SAT Writing score is excluded from the total scores for year from 2011 to 2016.