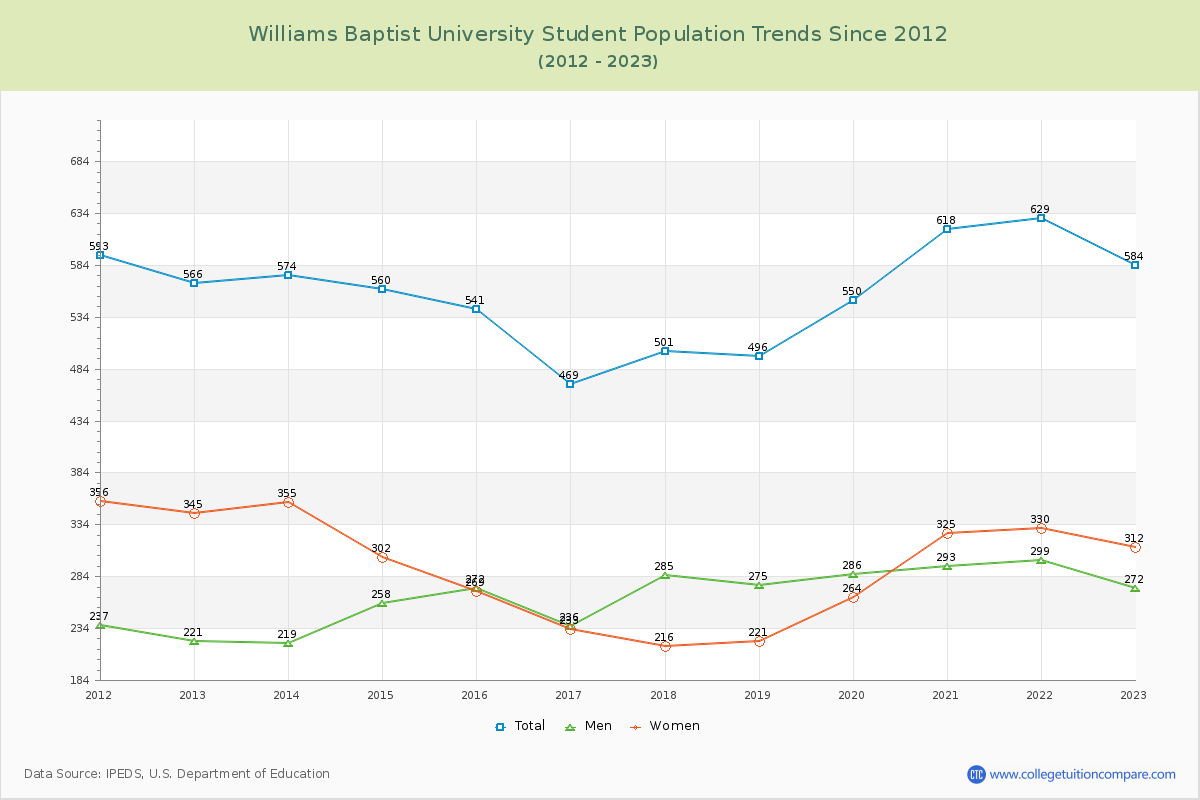
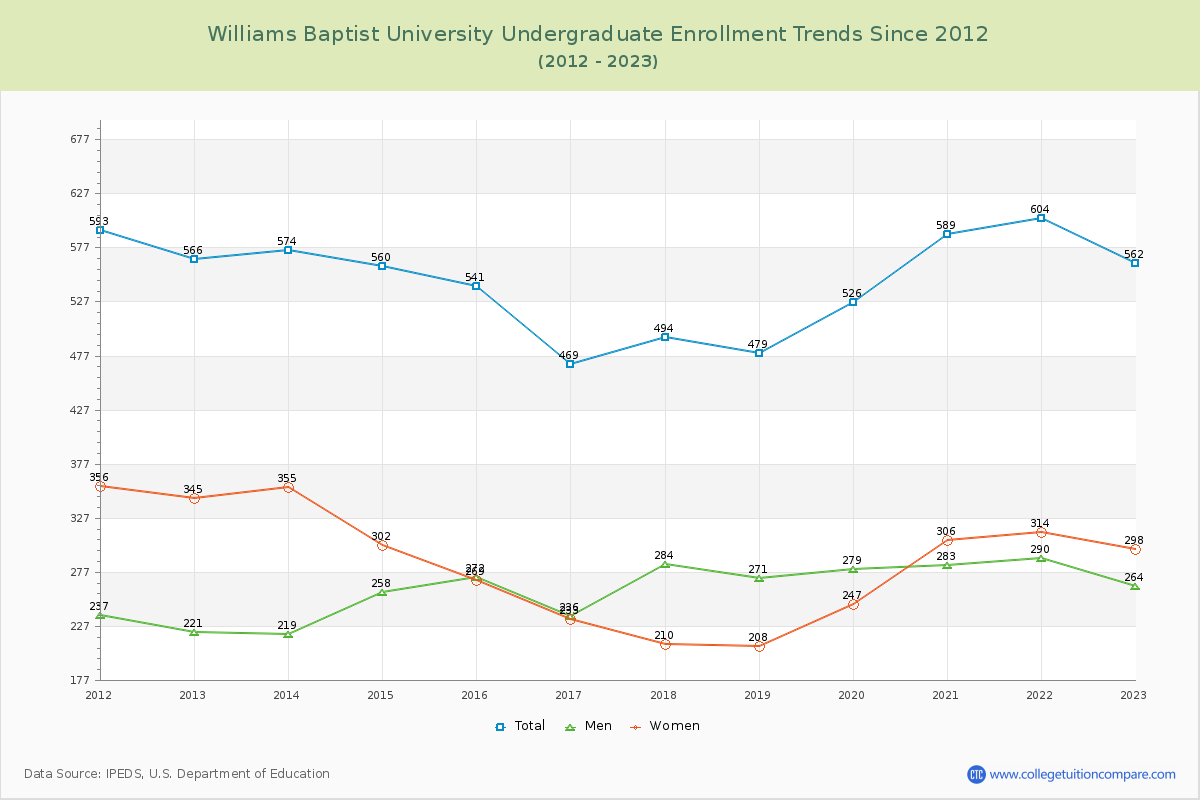
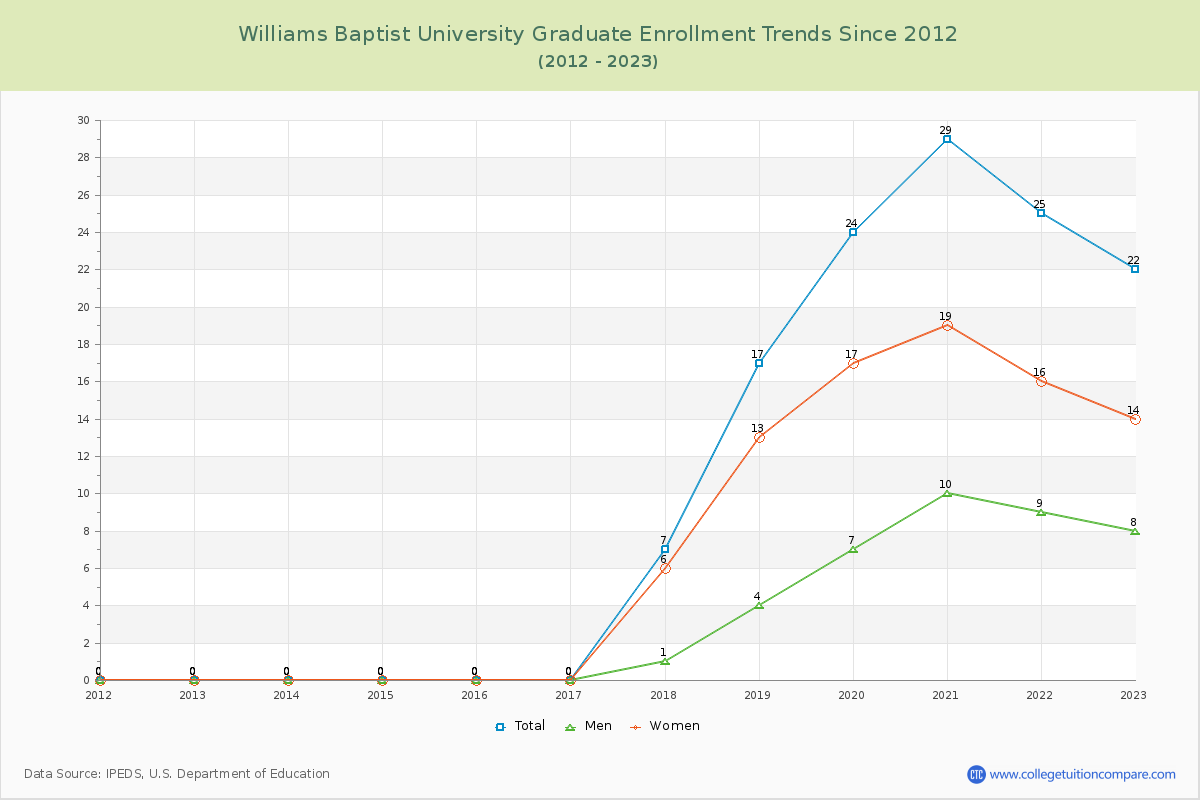
Student Population Changes
The average student population over the last 12 years is 553 where 584 students are attending the school for the academic year 2022-2023.
96.23% of total students is undergraduate students and 3.77% students is graduate students. The number of undergraduate students has decreased by 4 and the graduate enrollment has increased by 22 over past 10 years.
The female to male ratio is 1.15 to 1 and it means that there are slightly more female students enrolled in Williams Baptist than male students.
The following table and chart illustrate the changes in student population by gender at Williams Baptist University since 2012.
| Year | Total | Undergraduate | Graduate | ||||
|---|---|---|---|---|---|---|---|
| Total | Men | Women | Total | Men | Women | ||
| 2012-13 | 566 | 566 | 221 | 345 | 0 | 0 | 0 |
| 2013-14 | 574 8 | 574 8 | 219 -2 | 355 10 | 0 0 | 0 0 | 0 0 |
| 2014-15 | 560 -14 | 560 -14 | 258 39 | 302 -53 | 0 0 | 0 0 | 0 0 |
| 2015-16 | 541 -19 | 541 -19 | 272 14 | 269 -33 | 0 0 | 0 0 | 0 0 |
| 2016-17 | 469 -72 | 469 -72 | 236 -36 | 233 -36 | 0 0 | 0 0 | 0 0 |
| 2017-18 | 501 32 | 494 25 | 284 48 | 210 -23 | 7 7 | 1 1 | 6 6 |
| 2018-19 | 496 -5 | 479 -15 | 271 -13 | 208 -2 | 17 10 | 4 3 | 13 7 |
| 2019-20 | 550 54 | 526 47 | 279 8 | 247 39 | 24 7 | 7 3 | 17 4 |
| 2020-21 | 618 68 | 589 63 | 283 4 | 306 59 | 29 5 | 10 3 | 19 2 |
| 2021-22 | 629 11 | 604 15 | 290 7 | 314 8 | 25 -4 | 9 -1 | 16 -3 |
| 2022-23 | 584 -45 | 562 -42 | 264 -26 | 298 -16 | 22 -3 | 8 -1 | 14 -2 |
| Average | 553 | 542 | 262 | 281 | 11 | 4 | 8 |