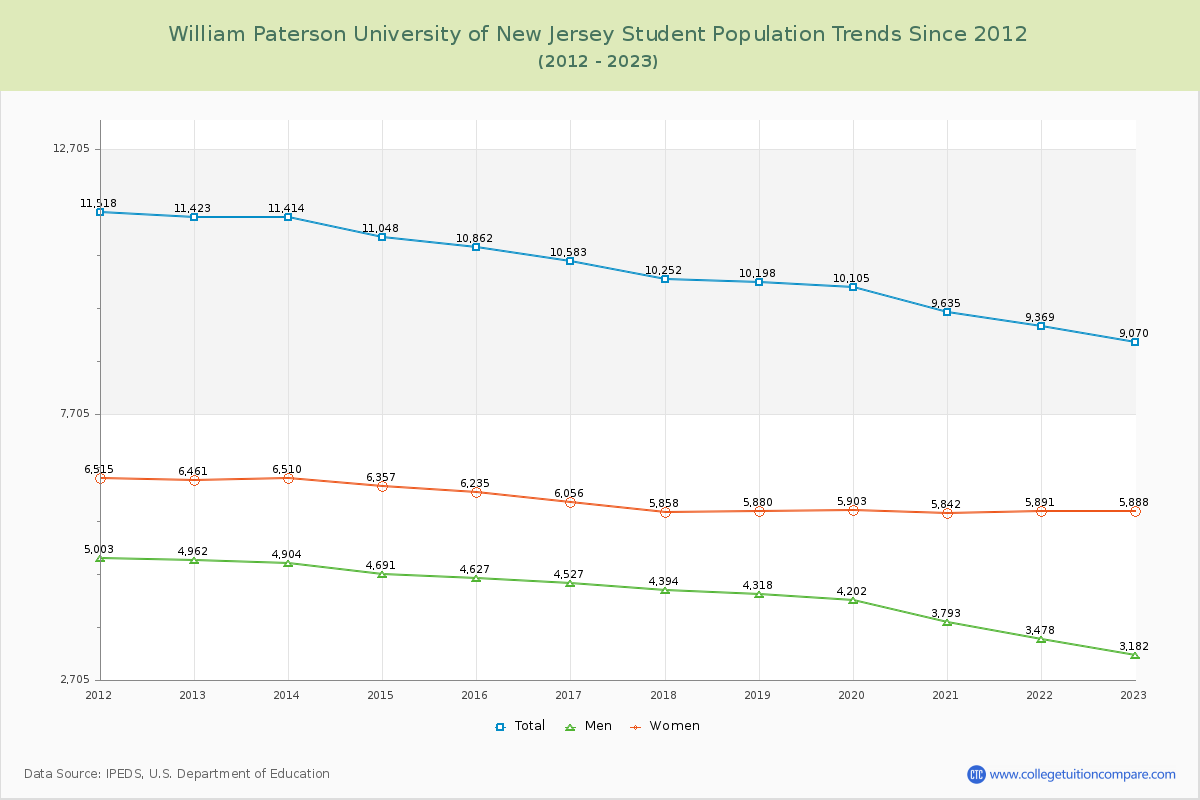
Student Population Changes
The average student population over the last 12 years is 10,360 where 9,070 students are attending the school for the academic year 2022-2023.
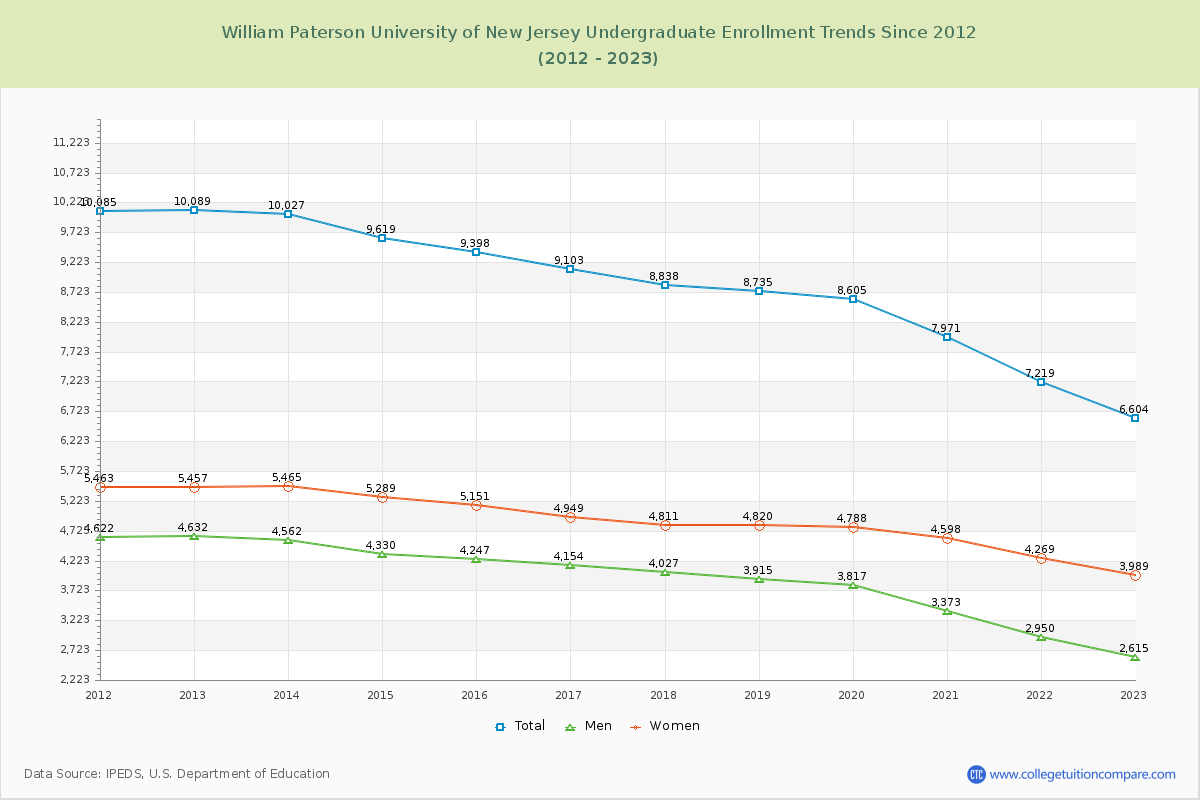
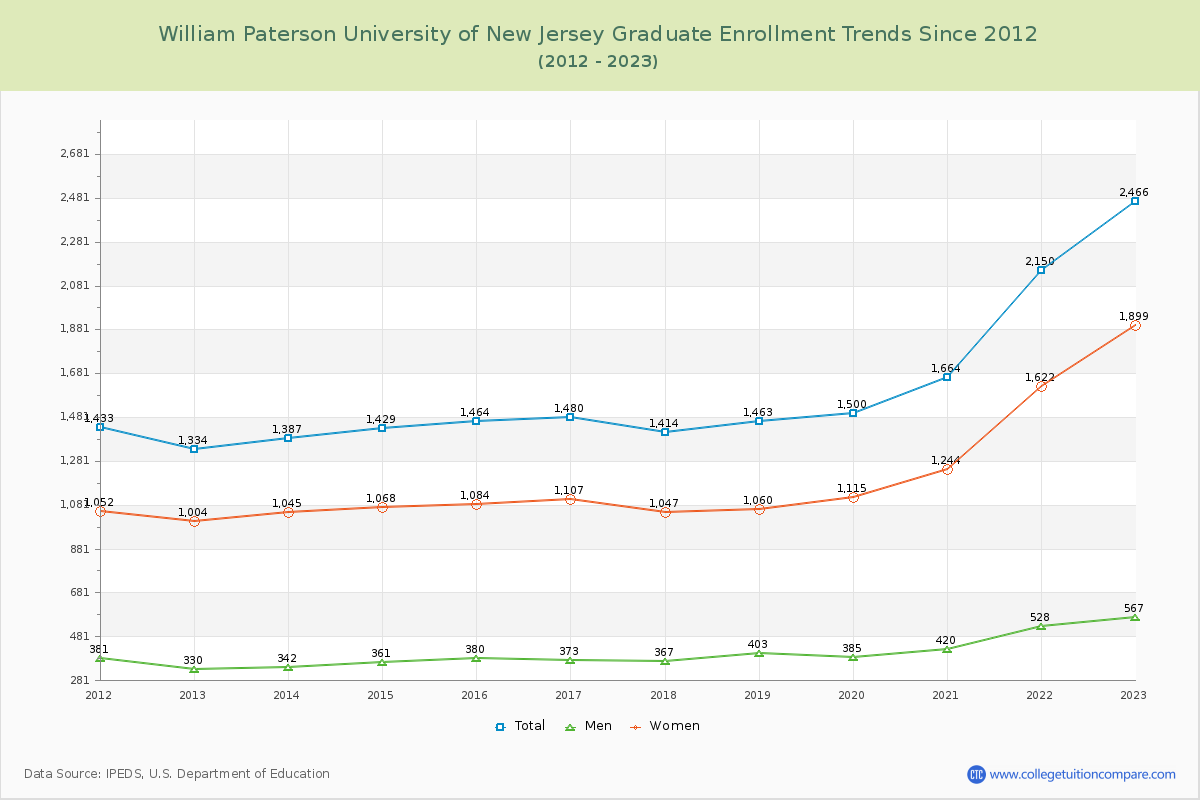
72.81% of total students is undergraduate students and 27.19% students is graduate students. The number of undergraduate students has decreased by 3,485 and the graduate enrollment has increased by 1,132 over past 10 years.
The female to male ratio is 1.85 to 1 and it means that there are more female students enrolled in William Paterson University of New Jersey than male students.
The following table and chart illustrate the changes in student population by gender at William Paterson University of New Jersey since 2012.
| Year | Total | Undergraduate | Graduate | ||||
|---|---|---|---|---|---|---|---|
| Total | Men | Women | Total | Men | Women | ||
| 2012-13 | 11,423 | 10,089 | 4,632 | 5,457 | 1,334 | 330 | 1,004 |
| 2013-14 | 11,414 -9 | 10,027 -62 | 4,562 -70 | 5,465 8 | 1,387 53 | 342 12 | 1,045 41 |
| 2014-15 | 11,048 -366 | 9,619 -408 | 4,330 -232 | 5,289 -176 | 1,429 42 | 361 19 | 1,068 23 |
| 2015-16 | 10,862 -186 | 9,398 -221 | 4,247 -83 | 5,151 -138 | 1,464 35 | 380 19 | 1,084 16 |
| 2016-17 | 10,583 -279 | 9,103 -295 | 4,154 -93 | 4,949 -202 | 1,480 16 | 373 -7 | 1,107 23 |
| 2017-18 | 10,252 -331 | 8,838 -265 | 4,027 -127 | 4,811 -138 | 1,414 -66 | 367 -6 | 1,047 -60 |
| 2018-19 | 10,198 -54 | 8,735 -103 | 3,915 -112 | 4,820 9 | 1,463 49 | 403 36 | 1,060 13 |
| 2019-20 | 10,105 -93 | 8,605 -130 | 3,817 -98 | 4,788 -32 | 1,500 37 | 385 -18 | 1,115 55 |
| 2020-21 | 9,635 -470 | 7,971 -634 | 3,373 -444 | 4,598 -190 | 1,664 164 | 420 35 | 1,244 129 |
| 2021-22 | 9,369 -266 | 7,219 -752 | 2,950 -423 | 4,269 -329 | 2,150 486 | 528 108 | 1,622 378 |
| 2022-23 | 9,070 -299 | 6,604 -615 | 2,615 -335 | 3,989 -280 | 2,466 316 | 567 39 | 1,899 277 |
| Average | 10,360 | 8,746 | 3,875 | 4,871 | 1,614 | 405 | 1,209 |