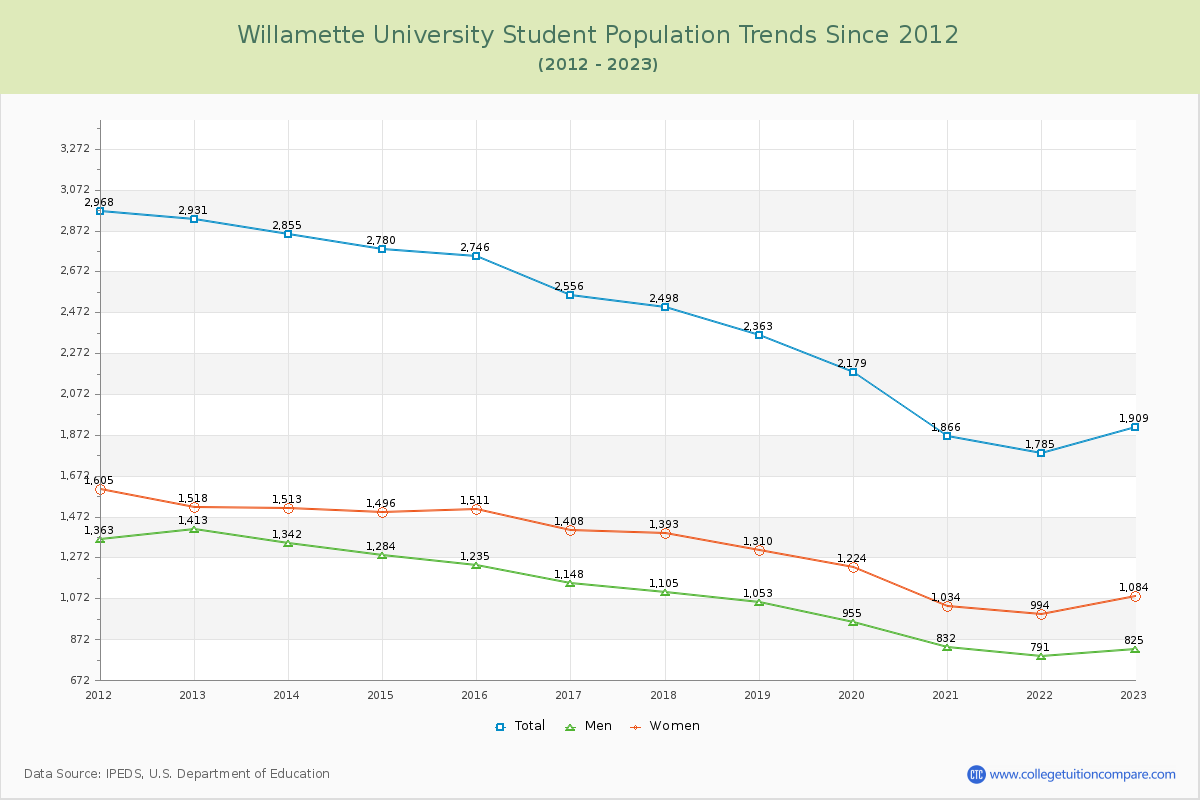
Student Population Changes
The average student population over the last 12 years is 2,406 where 1,909 students are attending the school for the academic year 2022-2023.
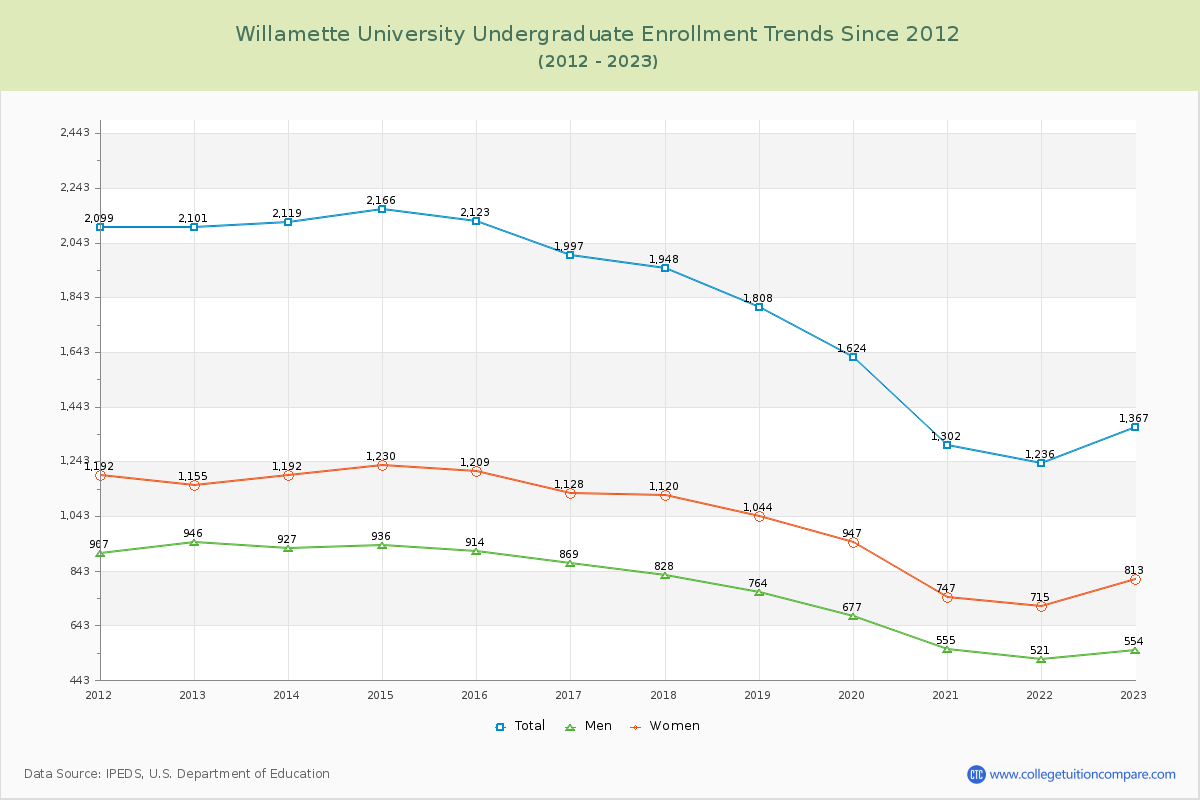
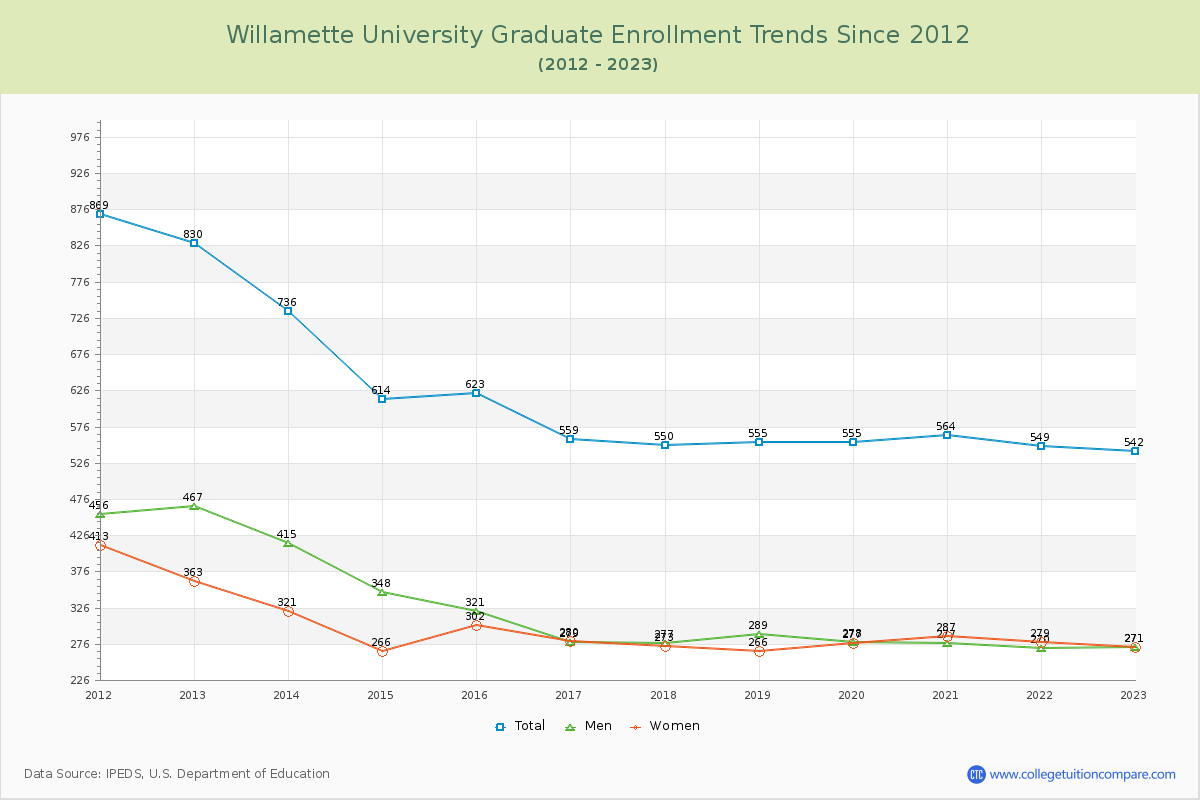
71.61% of total students is undergraduate students and 28.39% students is graduate students. The number of undergraduate students has decreased by 734 and the graduate enrollment has decreased by 288 over past 10 years.
The female to male ratio is 1.31 to 1 and it means that there are more female students enrolled in Willamette than male students.
The following table and chart illustrate the changes in student population by gender at Willamette University since 2012.
| Year | Total | Undergraduate | Graduate | ||||
|---|---|---|---|---|---|---|---|
| Total | Men | Women | Total | Men | Women | ||
| 2012-13 | 2,931 | 2,101 | 946 | 1,155 | 830 | 467 | 363 |
| 2013-14 | 2,855 -76 | 2,119 18 | 927 -19 | 1,192 37 | 736 -94 | 415 -52 | 321 -42 |
| 2014-15 | 2,780 -75 | 2,166 47 | 936 9 | 1,230 38 | 614 -122 | 348 -67 | 266 -55 |
| 2015-16 | 2,746 -34 | 2,123 -43 | 914 -22 | 1,209 -21 | 623 9 | 321 -27 | 302 36 |
| 2016-17 | 2,556 -190 | 1,997 -126 | 869 -45 | 1,128 -81 | 559 -64 | 279 -42 | 280 -22 |
| 2017-18 | 2,498 -58 | 1,948 -49 | 828 -41 | 1,120 -8 | 550 -9 | 277 -2 | 273 -7 |
| 2018-19 | 2,363 -135 | 1,808 -140 | 764 -64 | 1,044 -76 | 555 5 | 289 12 | 266 -7 |
| 2019-20 | 2,179 -184 | 1,624 -184 | 677 -87 | 947 -97 | 555 0 | 278 -11 | 277 11 |
| 2020-21 | 1,866 -313 | 1,302 -322 | 555 -122 | 747 -200 | 564 9 | 277 -1 | 287 10 |
| 2021-22 | 1,785 -81 | 1,236 -66 | 521 -34 | 715 -32 | 549 -15 | 270 -7 | 279 -8 |
| 2022-23 | 1,909 124 | 1,367 131 | 554 33 | 813 98 | 542 -7 | 271 1 | 271 -8 |
| Average | 2,406 | 1,799 | 772 | 1,027 | 607 | 317 | 290 |