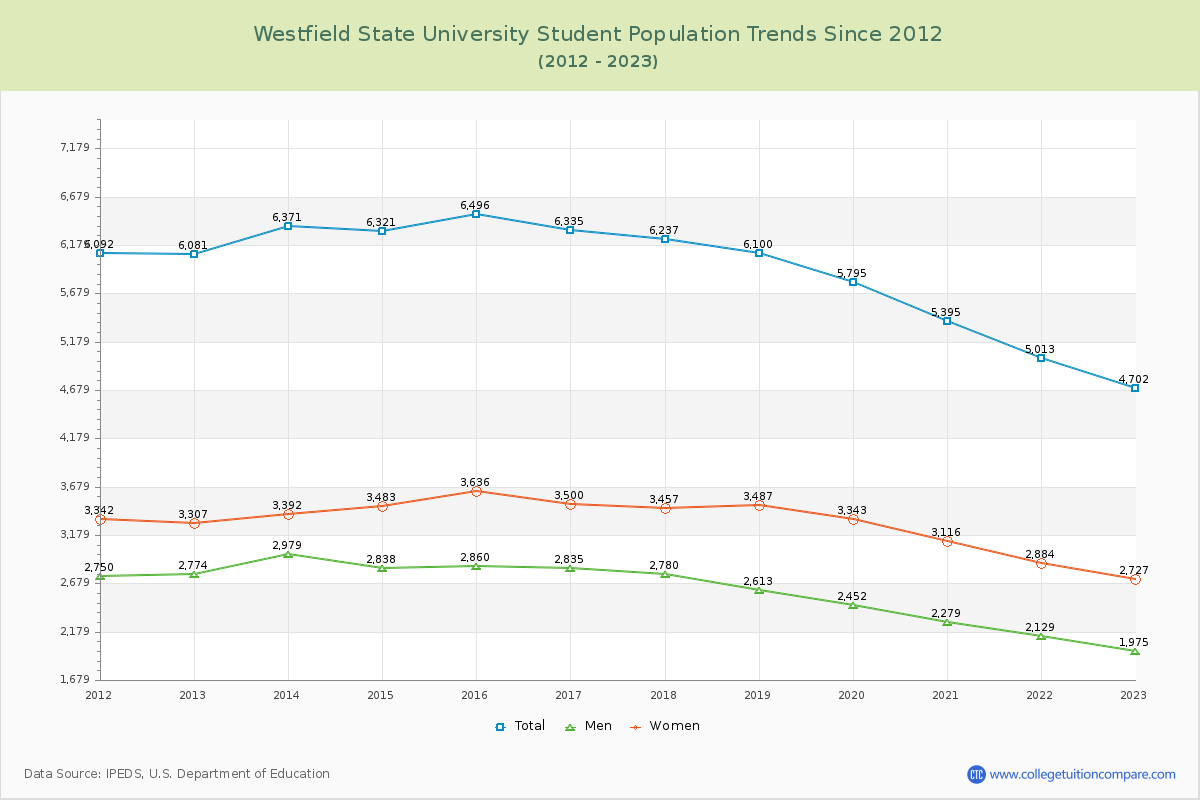
Student Population Changes
The average student population over the last 12 years is 5,895 where 4,702 students are attending the school for the academic year 2022-2023.
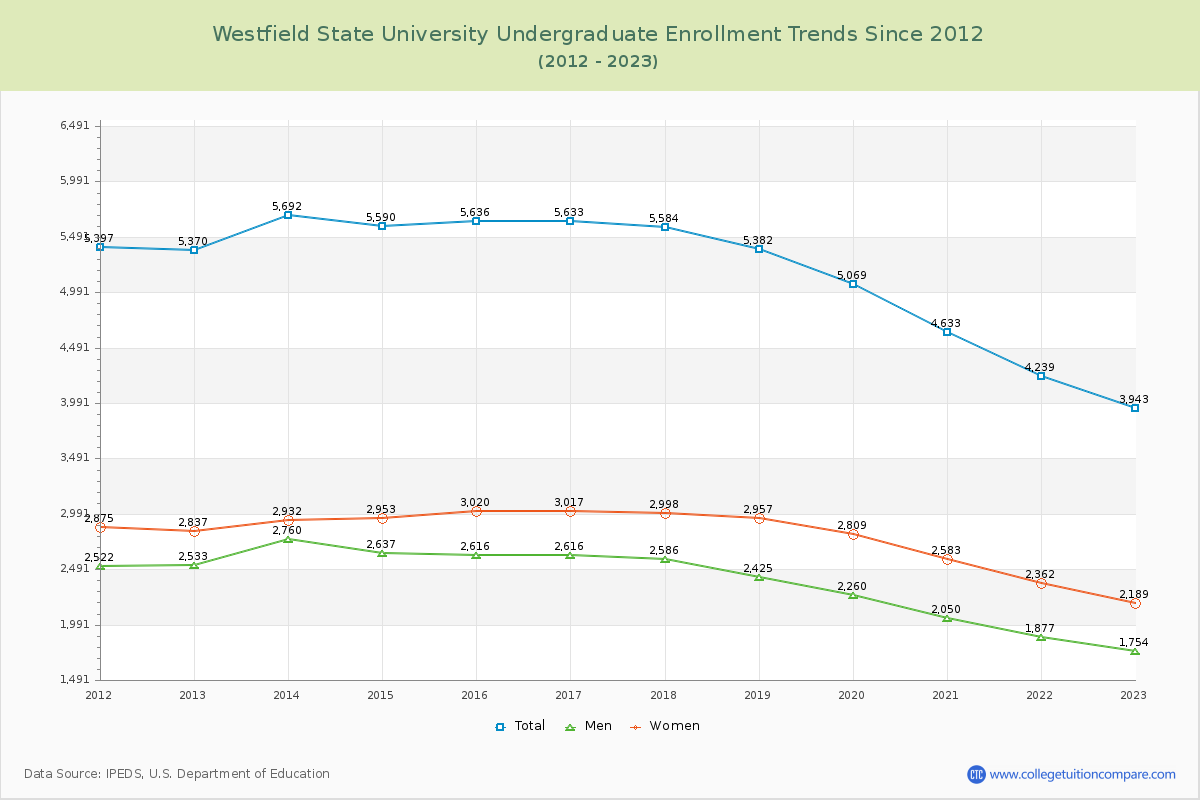
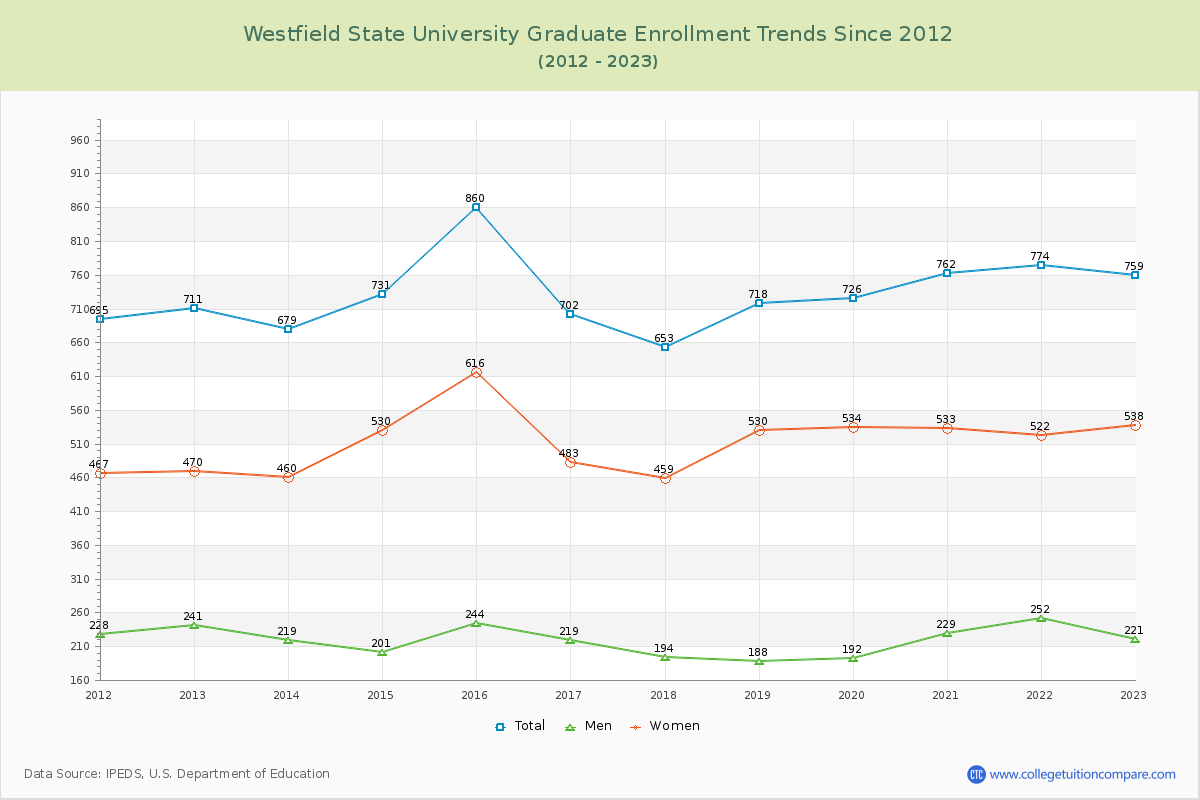
83.86% of total students is undergraduate students and 16.14% students is graduate students. The number of undergraduate students has decreased by 1,427 and the graduate enrollment has increased by 48 over past 10 years.
The female to male ratio is 1.38 to 1 and it means that there are more female students enrolled in Westfield State than male students.
The following table and chart illustrate the changes in student population by gender at Westfield State University since 2012.
| Year | Total | Undergraduate | Graduate | ||||
|---|---|---|---|---|---|---|---|
| Total | Men | Women | Total | Men | Women | ||
| 2012-13 | 6,081 | 5,370 | 2,533 | 2,837 | 711 | 241 | 470 |
| 2013-14 | 6,371 290 | 5,692 322 | 2,760 227 | 2,932 95 | 679 -32 | 219 -22 | 460 -10 |
| 2014-15 | 6,321 -50 | 5,590 -102 | 2,637 -123 | 2,953 21 | 731 52 | 201 -18 | 530 70 |
| 2015-16 | 6,496 175 | 5,636 46 | 2,616 -21 | 3,020 67 | 860 129 | 244 43 | 616 86 |
| 2016-17 | 6,335 -161 | 5,633 -3 | 2,616 0 | 3,017 -3 | 702 -158 | 219 -25 | 483 -133 |
| 2017-18 | 6,237 -98 | 5,584 -49 | 2,586 -30 | 2,998 -19 | 653 -49 | 194 -25 | 459 -24 |
| 2018-19 | 6,100 -137 | 5,382 -202 | 2,425 -161 | 2,957 -41 | 718 65 | 188 -6 | 530 71 |
| 2019-20 | 5,795 -305 | 5,069 -313 | 2,260 -165 | 2,809 -148 | 726 8 | 192 4 | 534 4 |
| 2020-21 | 5,395 -400 | 4,633 -436 | 2,050 -210 | 2,583 -226 | 762 36 | 229 37 | 533 -1 |
| 2021-22 | 5,013 -382 | 4,239 -394 | 1,877 -173 | 2,362 -221 | 774 12 | 252 23 | 522 -11 |
| 2022-23 | 4,702 -311 | 3,943 -296 | 1,754 -123 | 2,189 -173 | 759 -15 | 221 -31 | 538 16 |
| Average | 5,895 | 5,161 | 2,374 | 2,787 | 734 | 218 | 516 |