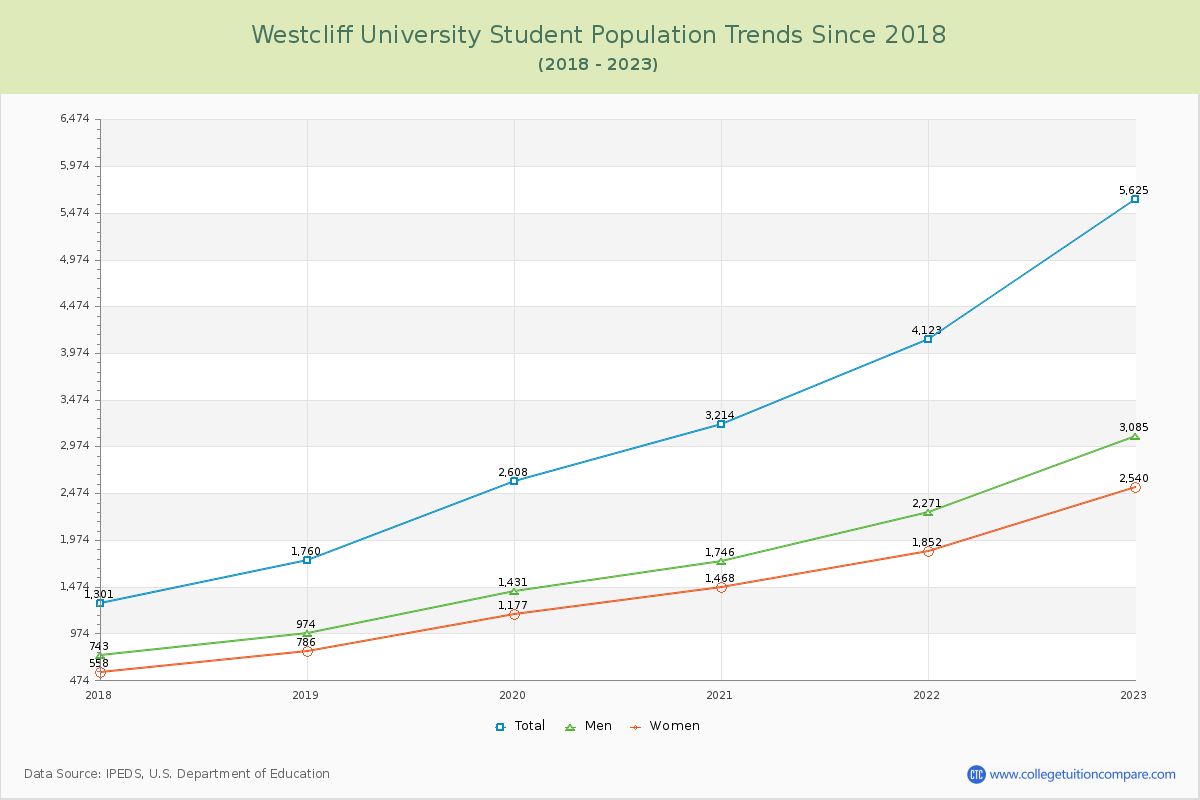
Student Population Changes
The average student population over the last 7 years is 3,105 where 5,625 students are attending the school for the academic year 2022-2023.
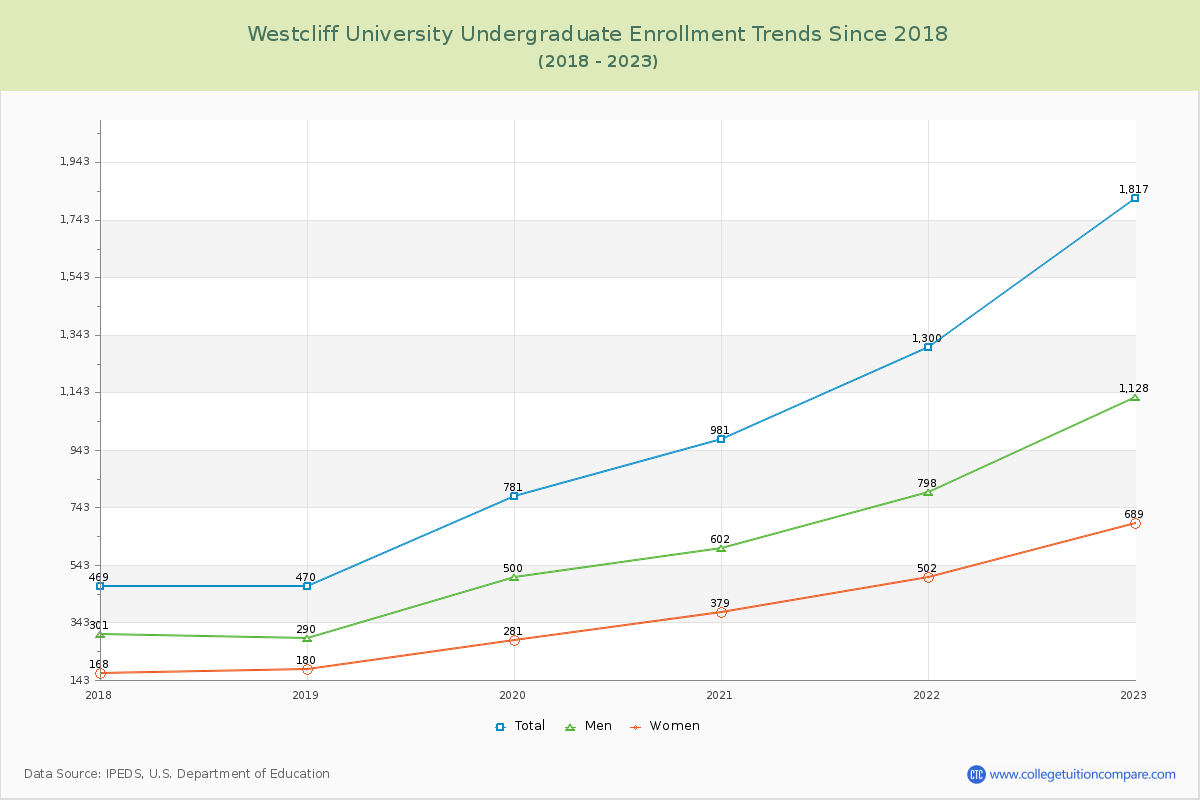
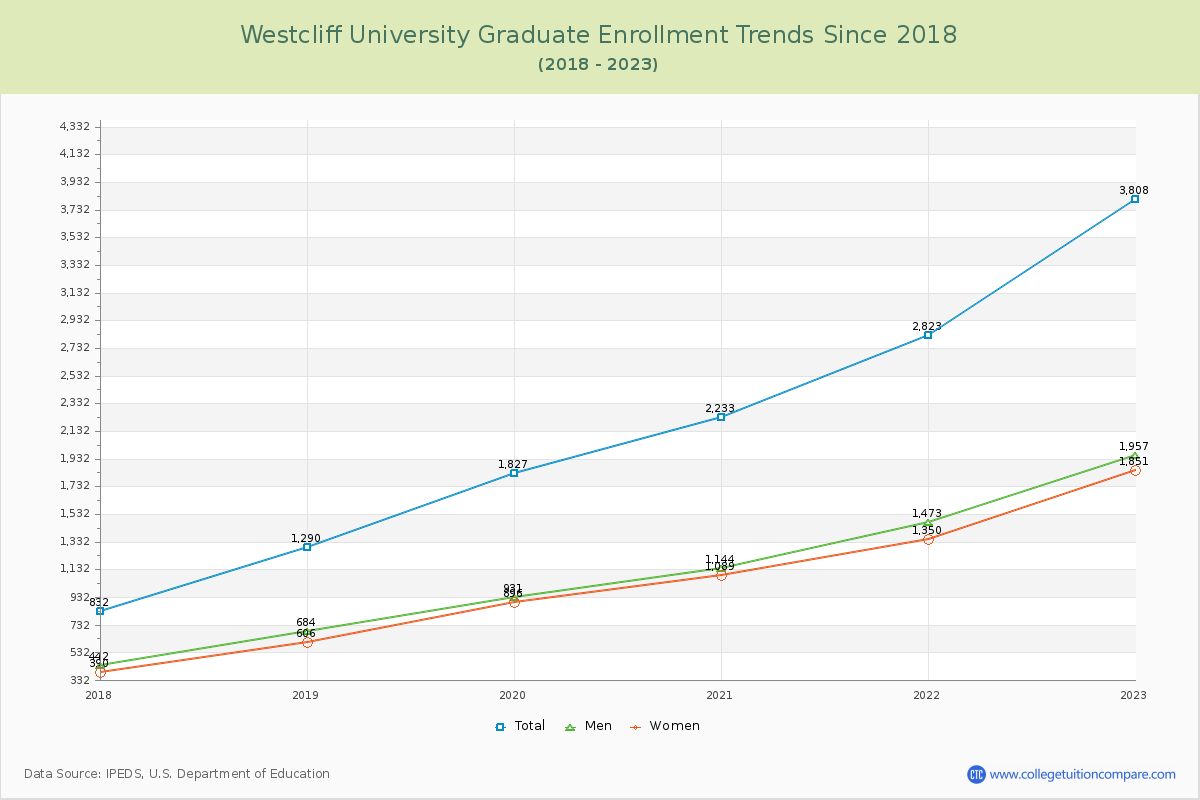
32.30% of total students is undergraduate students and 67.70% students is graduate students. The number of undergraduate students has increased by 1,348 and the graduate enrollment has increased by 2,976 over past 10 years.
The female to male ratio is 0.82 to 1 and it means that there are slightly more male students enrolled in Westcliff than female students.
The following table and chart illustrate the changes in student population by gender at Westcliff University since 2017.
| Year | Total | Undergraduate | Graduate | ||||
|---|---|---|---|---|---|---|---|
| Total | Men | Women | Total | Men | Women | ||
| 2017-18 | 1,301 | 469 | 301 | 168 | 832 | 442 | 390 |
| 2018-19 | 1,760 459 | 470 1 | 290 -11 | 180 12 | 1,290 458 | 684 242 | 606 216 |
| 2019-20 | 2,608 848 | 781 311 | 500 210 | 281 101 | 1,827 537 | 931 247 | 896 290 |
| 2020-21 | 3,214 606 | 981 200 | 602 102 | 379 98 | 2,233 406 | 1,144 213 | 1,089 193 |
| 2021-22 | 4,123 909 | 1,300 319 | 798 196 | 502 123 | 2,823 590 | 1,473 329 | 1,350 261 |
| 2022-23 | 5,625 1,502 | 1,817 517 | 1,128 330 | 689 187 | 3,808 985 | 1,957 484 | 1,851 501 |
| Average | 3,105 | 970 | 603 | 367 | 2,136 | 1,105 | 1,030 |