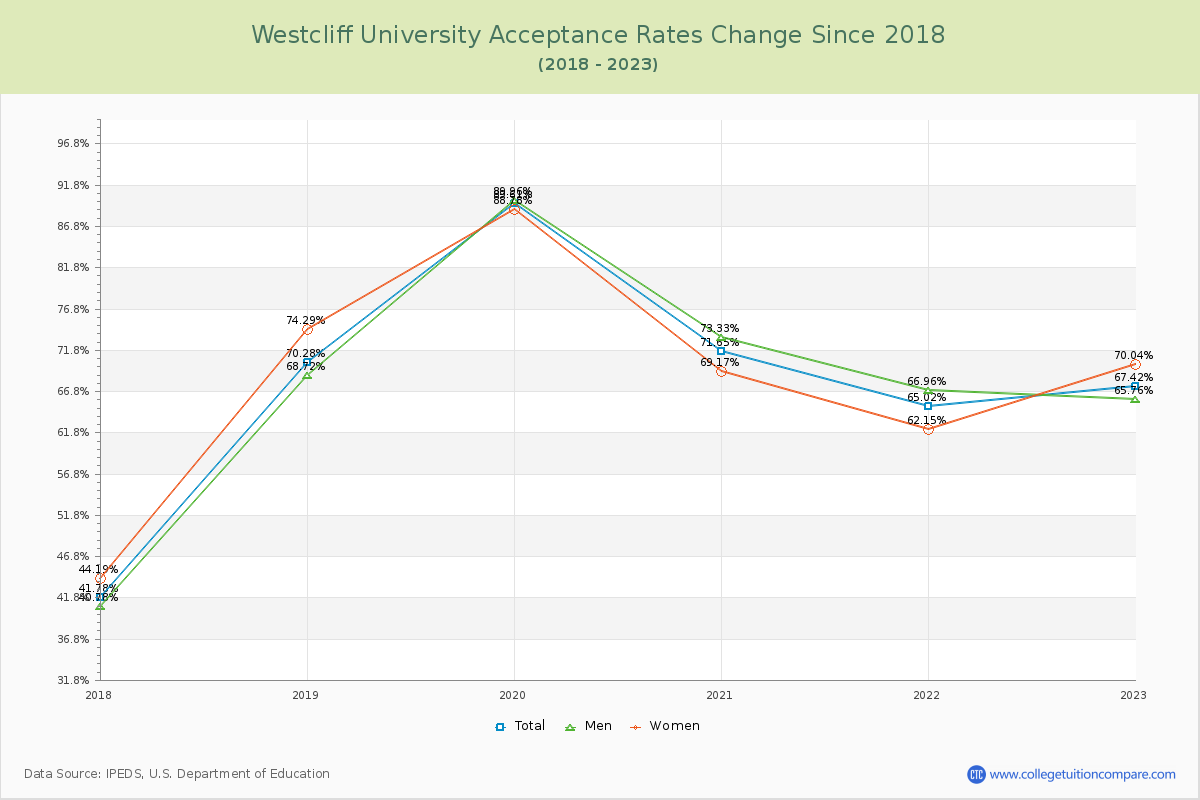
Acceptance Rate Changes
The average acceptance rate over the last 10 years is 67.63%, and this year's acceptance rate is 67.42% at Westcliff University. By gender, men students' acceptance rate is 67.58% and women students' rate is 68.10%.
The next table and chart illustrate the acceptance rates changes at Westcliff University over the past 6 years (2017-2023).
| Year | Total | Men | Women |
|---|---|---|---|
| 2017-18 | 41.78% | 40.78% | 44.19% |
| 2018-19 | 70.28% 28.50% |
68.72% 30.10% |
74.29% 30.10% |
| 2019-20 | 89.61% 19.33% |
89.96% 14.49% |
88.78% 14.49% |
| 2020-21 | 71.65% -17.97% |
73.33% -19.60% |
69.17% -19.60% |
| 2021-22 | 65.02% -6.62% |
66.96% -7.03% |
62.15% -7.03% |
| 2022-23 | 67.42% 2.40% |
65.76% 7.89% |
70.04% 7.89% |
| Average | 67.63% | 67.58% | 68.10% |