Enrollment Trends at West Virginia Wesleyan

-463

Total Enrollment

-160

Men

-303

Women

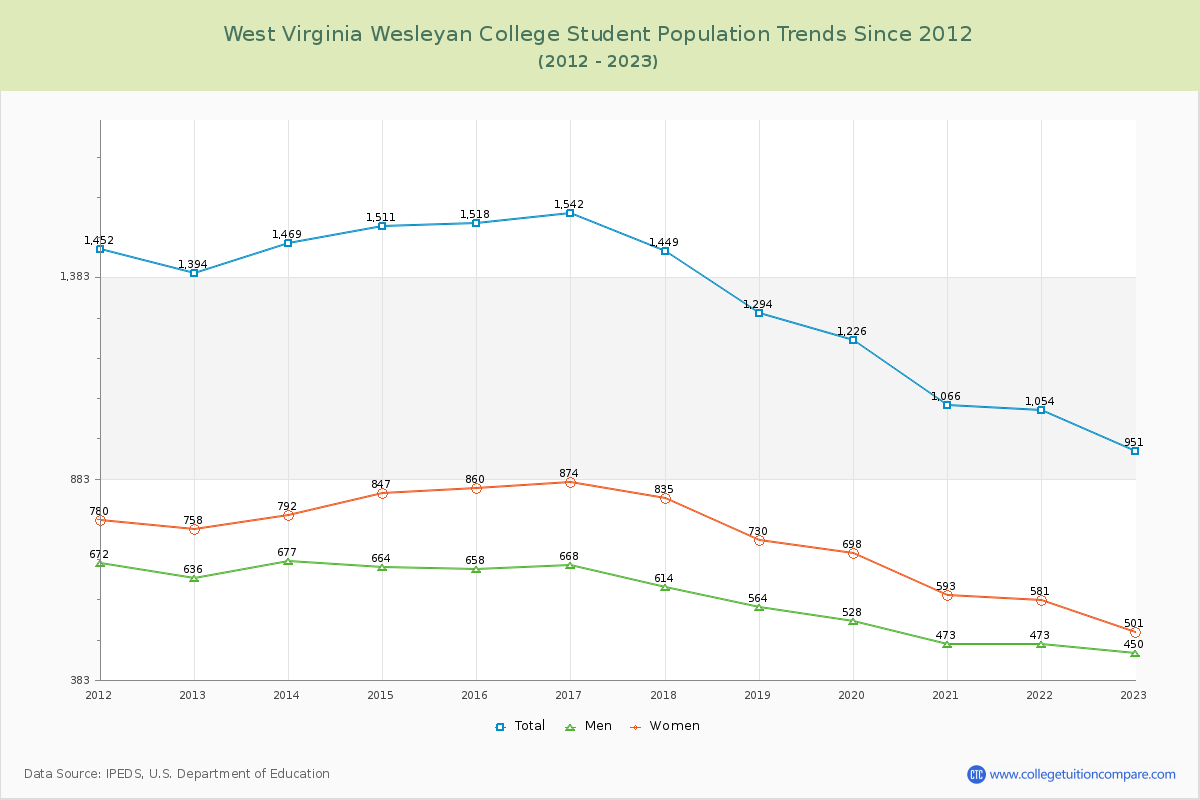
The student population at West Virginia Wesleyan College is 1,055 (971 undergraduate and 84 graduate students) . The number of students has decreased by 463 over the past decade.

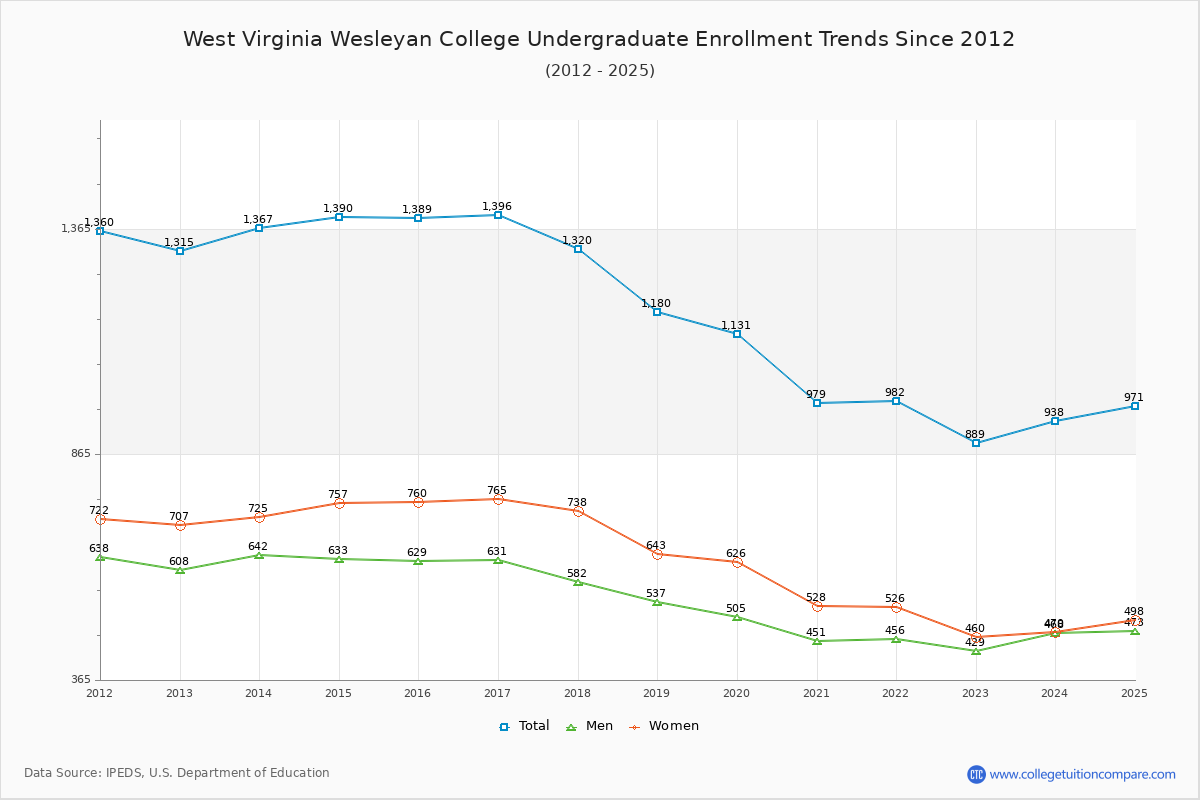
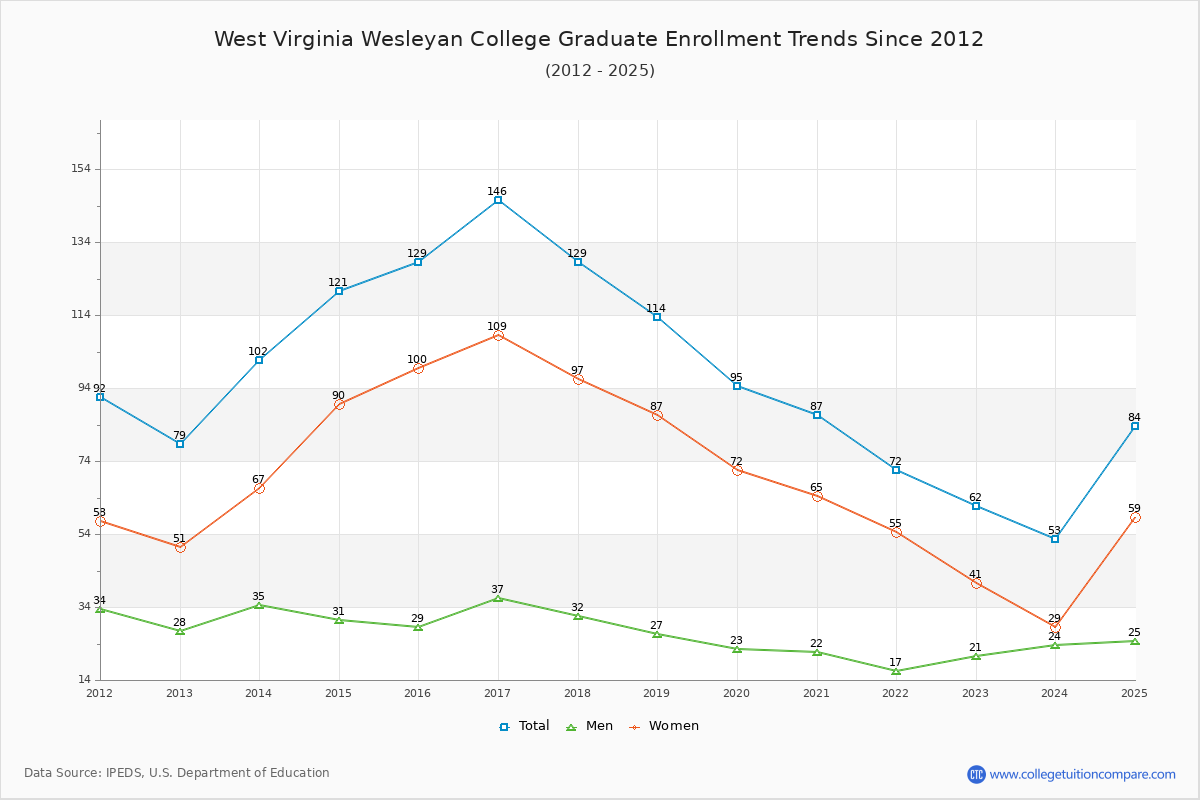
The percentage of undergraduate students at West Virginia Wesleyan is 92.04% which is decreased by 418 over last 10 years. The graduate student population decreased by 45 and it has been decreasing.

The female to male ratio is 1.12 to 1 which means that female students enrolled slightly more than male students.

53 students enrolled in online degree program exclusively and the number of online students has decreased by -11.67% since 2015.

Student Population Changes

The average student population over the last 11 years is 1,215 where 1,055 students are attending the school for the academic year 2024-2025.

92.04% of total students is undergraduate students and 7.96% students is graduate students. The number of undergraduate students has decreased by 418 and the graduate enrollment has decreased by 45 over past 10 years.

The female to male ratio is 1.12 to 1 and it means that there are slightly more female students enrolled in West Virginia Wesleyan than male students.

The following table and chart illustrate the changes in student population by gender at West Virginia Wesleyan College since 2015.

YearTotalUndergraduateGraduate
TotalMenWomenTotalMenWomen
2015-161,5181,38962976012929100
2016-171,542
24
1,396
7
631
2
765
5
146
17
37
8
109
9
2017-181,449
-93
1,320
-76
582
-49
738
-27
129
-17
32
-5
97
-12
2018-191,294
-155
1,180
-140
537
-45
643
-95
114
-15
27
-5
87
-10
2019-201,226
-68
1,131
-49
505
-32
626
-17
95
-19
23
-4
72
-15
2020-211,066
-160
979
-152
451
-54
528
-98
87
-8
22
-1
65
-7
2021-221,054
-12
982
3
456
5
526
-2
72
-15
17
-5
55
-10
2022-23951
-103
889
-93
429
-27
460
-66
62
-10
21
4
41
-14
2023-24991
40
938
49
468
39
470
10
53
-9
24
3
29
-12
2024-251,055
64
971
33
473
5
498
28
84
31
25
1
59
30
Average1,2151,118516601972671
West Virginia Wesleyan College Enrollment Trends Chart

Undergraduate Enrollment Changes

The average number of Undergraduate students over the last 11 years is 1,118 where 971 students are attending the Undergraduate school for the academic year 2024-2025. The following table and chart illustrate the changes in Undergraduate enrollment by attending status and gender at West Virginia Wesleyan College since 2015.

YearTotalFull-timePart-time
TotalMenWomenTotalMenWomen
2015-161,3891,363614749261511
2016-171,3961,367618749291316
2017-181,3201,289567722311516
2018-191,1801,1625286341899
2019-201,1311,1184996191367
2020-21979971448523835
2021-229829704515191257
2022-238898774214561284
2023-24938906454452321418
2024-2597194946648322715
Average1,1181,1185075911,1181011
West Virginia Wesleyan College Undergraduate Enrollment Trends Chart

Graduate Enrollment Changes

The average number of Graduate students over the last 11 years is 97 where 84 students are attending the Graduate school for the academic year 2024-2025. The following table and chart illustrate the changes in Graduate enrollment by attending status and gender at West Virginia Wesleyan College since 2015.

YearTotalFull-timePart-time
TotalMenWomenTotalMenWomen
2015-16129115288714113
2016-17146134341001239
2017-181291203288909
2018-19114104277710010
2019-209583226112111
2020-2187812160615
2021-2272651748707
2022-236248192914212
2023-2453482127532
2024-2584802456413
Average979725639718
West Virginia Wesleyan College Graduate Enrollment Trends Chart

Enrollment by Race/Ethnicity Changes

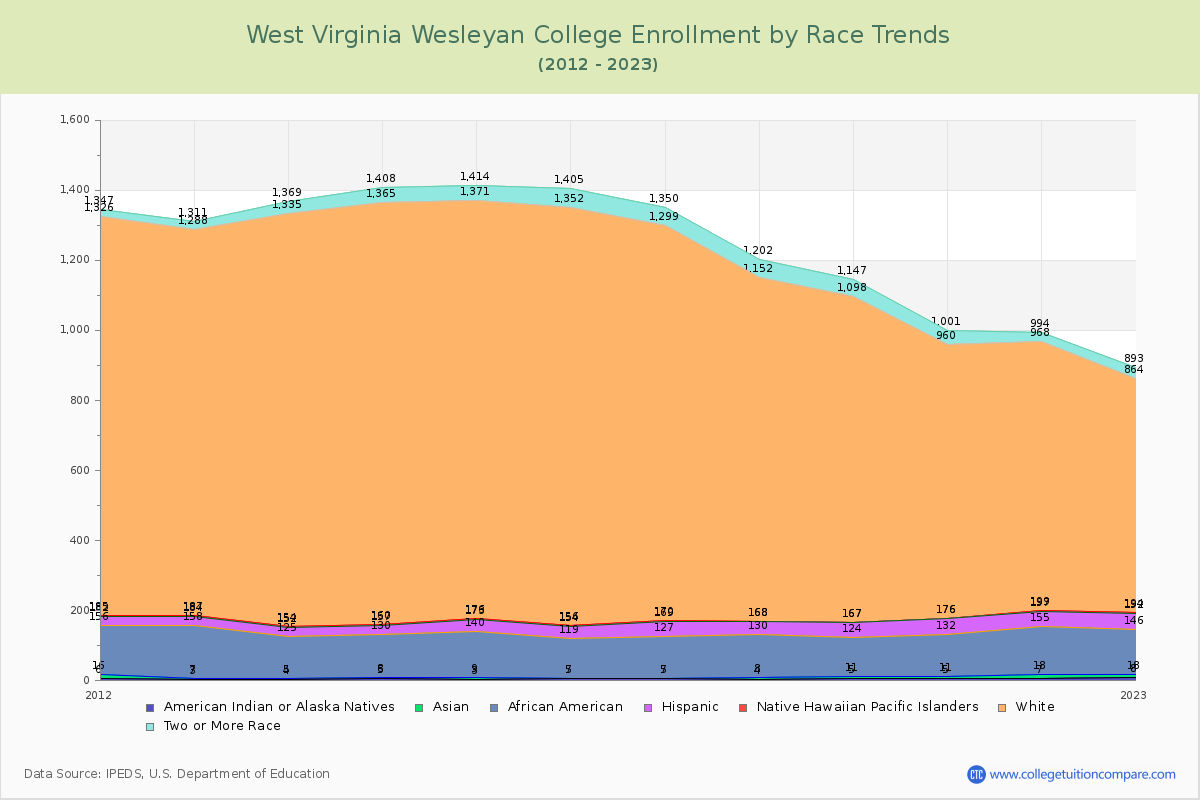
The percentage of white students is 67.20%. The percentage was 78.72% 10 years ago and West Virginia Wesleyan still has a high percentage of white students. 1.04% of enrolled students is Asian and 12.23% is black students. Hispanic students comprise 5.31% of the student body.

Over the past 10 years, the racial composition has shifted. The percentage of white students decreased from 78.72% to 67.20%. Asian enrollment grew from 0.40% to 1.04%. Black student enrollment increased from 8.63% to 12.23%. Hispanic student representation expanded from 2.17% to 5.31%.

The overall racial diversity, measured by the Census Bureau Diversity Index, is 0.5294 which indicates that somewhat diverse. This increased from 0.3715 a decade ago, suggesting that racial diversity has improved.

The following table and chart illustrate the student population trends by race/ethnicity at West Virginia Wesleyan College over the past 11 years (2015-2025).

YearAmerican Indian or Native AmericanAsianBlackHispanicNative Hawaiian or Other Pacific IslanderWhiteTwo or More Races
2015-16361313331,19543
2016-17521123521,19653
2017-18521204211,12951
2018-194412238098450
2019-205611343093149
2020-215612144078441
2021-2271113742276926
2022-2381012846267029
2023-2461111955166233
2024-2551112956470934
Average5712343290341
West Virginia Wesleyan College Enrollment by Race Trends Chart

Distance Learning (Online Courses) Enrollment Changes

53 students are enrolled in online degree programs exclusively for the academic year 2024-2025, which is 5% of total students. The number of online students has decreased -11.67% since 2015. The following table and chart illustrate the changes in the online student population by enrolled type at West Virginia Wesleyan College from 2015 to 2025.

YearTotal EnrollmentOnline CompletelyEnrolled in Some Online CoursesNot Enrolled in Online Courses
2015-161,518601021,356
2016-171,54261721,364
2017-181,449371851,227
2018-191,29438327929
2019-201,22658461,122
2020-211,0661,06600
2021-221,05430367657
2022-2395121257673
2023-2499120318653
2024-251,05553381621
Average1,215139216860

Ratings & Review

Share your experiences and thoughts about West Virginia Wesleyan College. It will be a great help to applicants and prospective students!