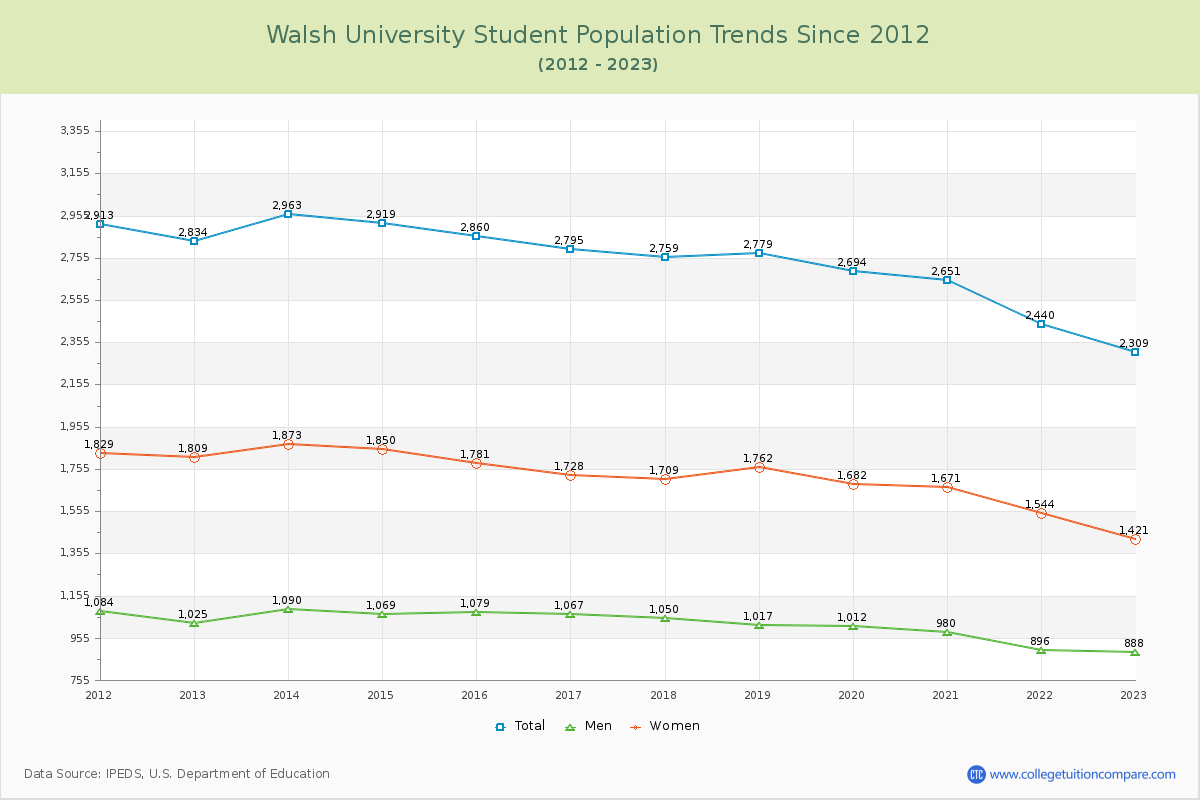
Student Population Changes
The average student population over the last 12 years is 2,728 where 2,309 students are attending the school for the academic year 2022-2023.
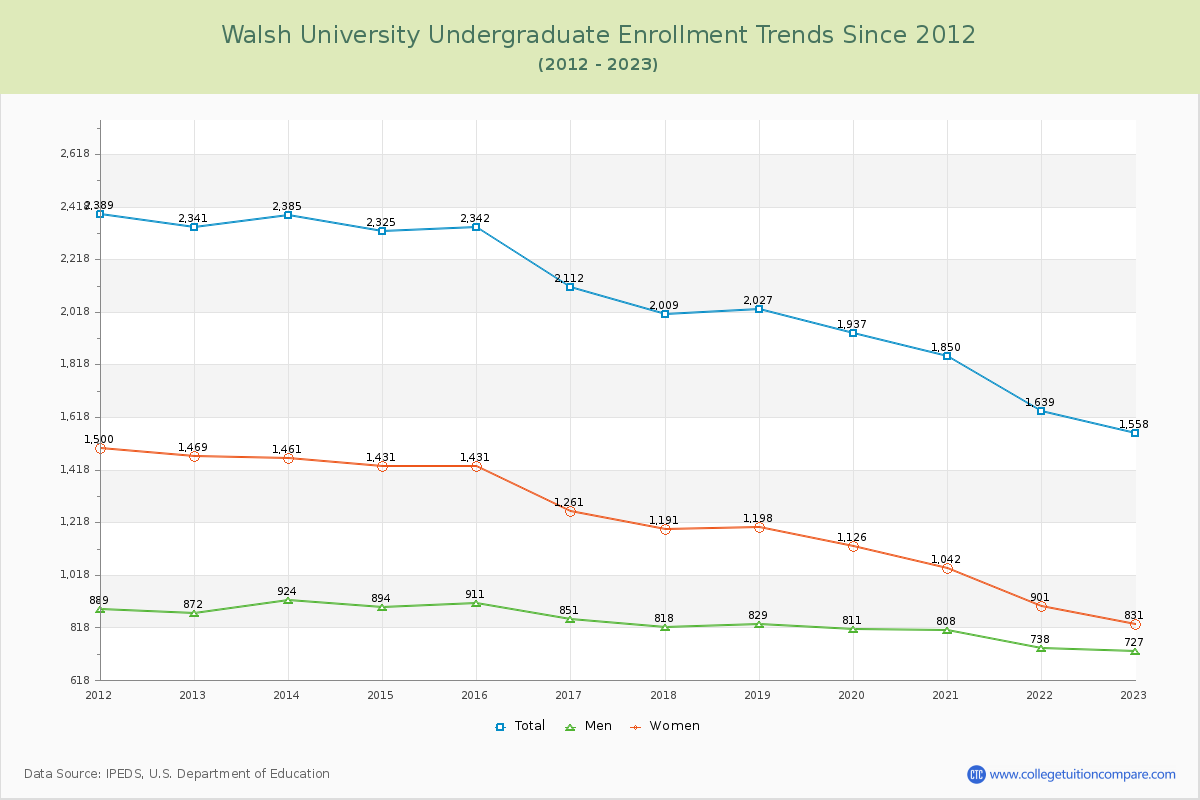
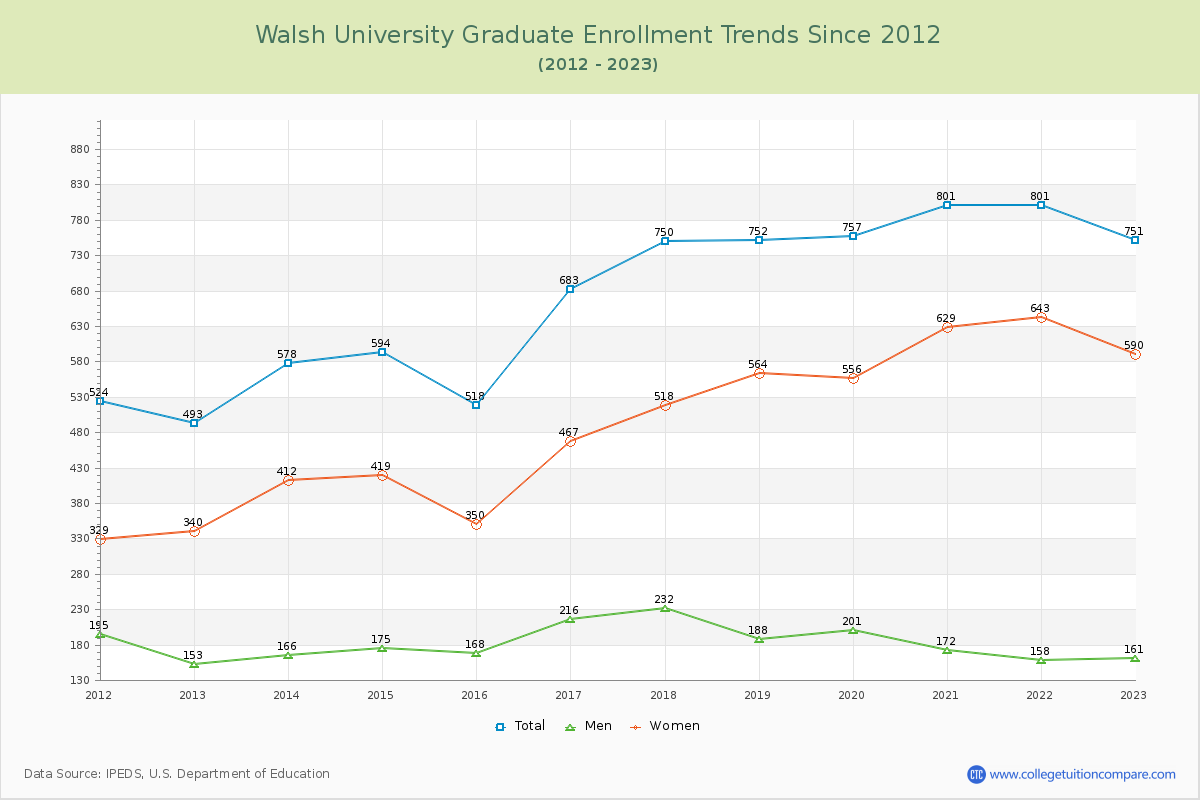
67.48% of total students is undergraduate students and 32.52% students is graduate students. The number of undergraduate students has decreased by 783 and the graduate enrollment has increased by 258 over past 10 years.
The female to male ratio is 1.60 to 1 and it means that there are more female students enrolled in Walsh than male students.
The following table and chart illustrate the changes in student population by gender at Walsh University since 2012.
| Year | Total | Undergraduate | Graduate | ||||
|---|---|---|---|---|---|---|---|
| Total | Men | Women | Total | Men | Women | ||
| 2012-13 | 2,834 | 2,341 | 872 | 1,469 | 493 | 153 | 340 |
| 2013-14 | 2,963 129 | 2,385 44 | 924 52 | 1,461 -8 | 578 85 | 166 13 | 412 72 |
| 2014-15 | 2,919 -44 | 2,325 -60 | 894 -30 | 1,431 -30 | 594 16 | 175 9 | 419 7 |
| 2015-16 | 2,860 -59 | 2,342 17 | 911 17 | 1,431 0 | 518 -76 | 168 -7 | 350 -69 |
| 2016-17 | 2,795 -65 | 2,112 -230 | 851 -60 | 1,261 -170 | 683 165 | 216 48 | 467 117 |
| 2017-18 | 2,759 -36 | 2,009 -103 | 818 -33 | 1,191 -70 | 750 67 | 232 16 | 518 51 |
| 2018-19 | 2,779 20 | 2,027 18 | 829 11 | 1,198 7 | 752 2 | 188 -44 | 564 46 |
| 2019-20 | 2,694 -85 | 1,937 -90 | 811 -18 | 1,126 -72 | 757 5 | 201 13 | 556 -8 |
| 2020-21 | 2,651 -43 | 1,850 -87 | 808 -3 | 1,042 -84 | 801 44 | 172 -29 | 629 73 |
| 2021-22 | 2,440 -211 | 1,639 -211 | 738 -70 | 901 -141 | 801 0 | 158 -14 | 643 14 |
| 2022-23 | 2,309 -131 | 1,558 -81 | 727 -11 | 831 -70 | 751 -50 | 161 3 | 590 -53 |
| Average | 2,728 | 2,048 | 835 | 1,213 | 680 | 181 | 499 |