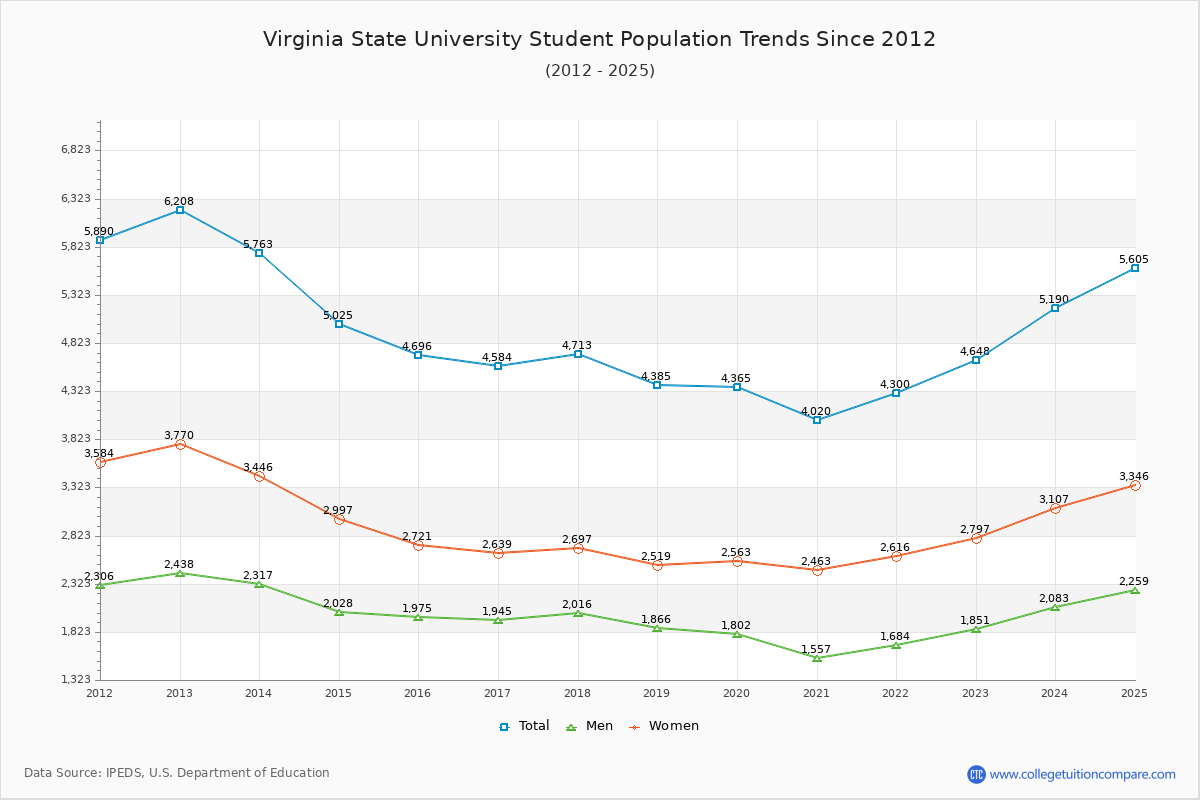
Student Population Changes
The average student population over the last 12 years is 4,792 where 4,648 students are attending the school for the academic year 2022-2023.
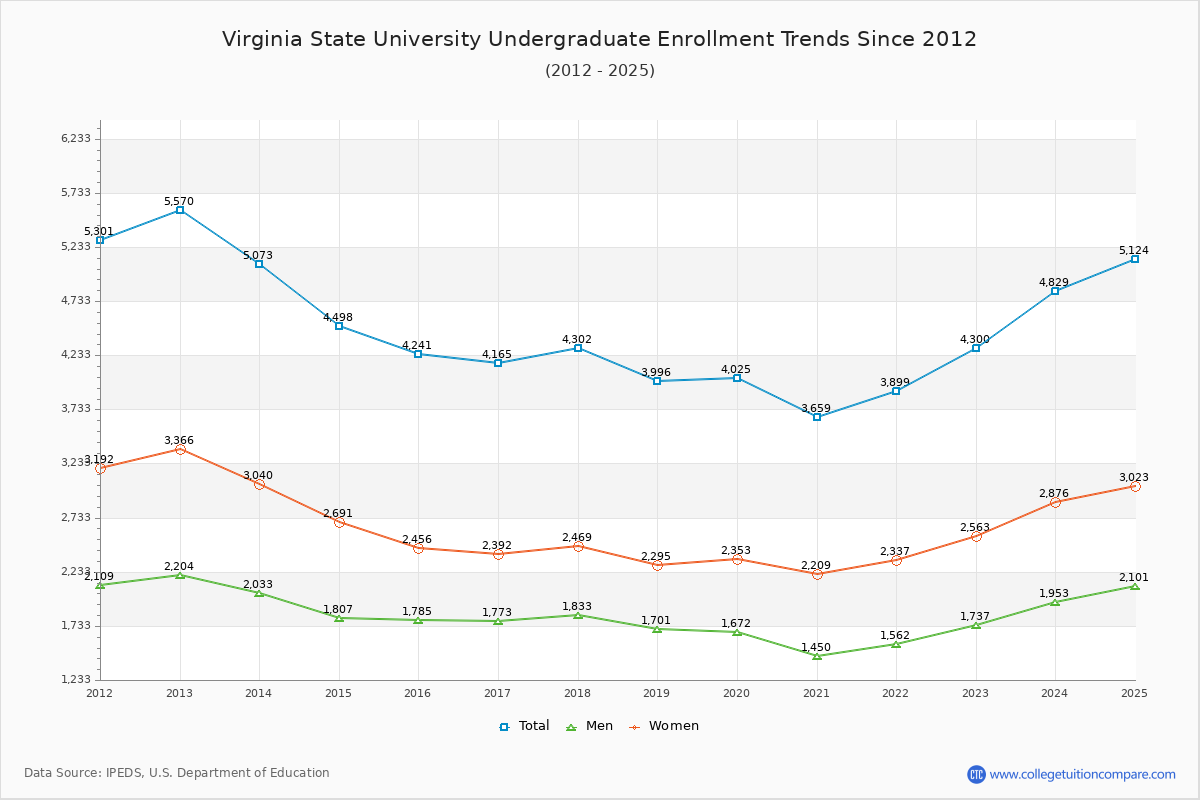
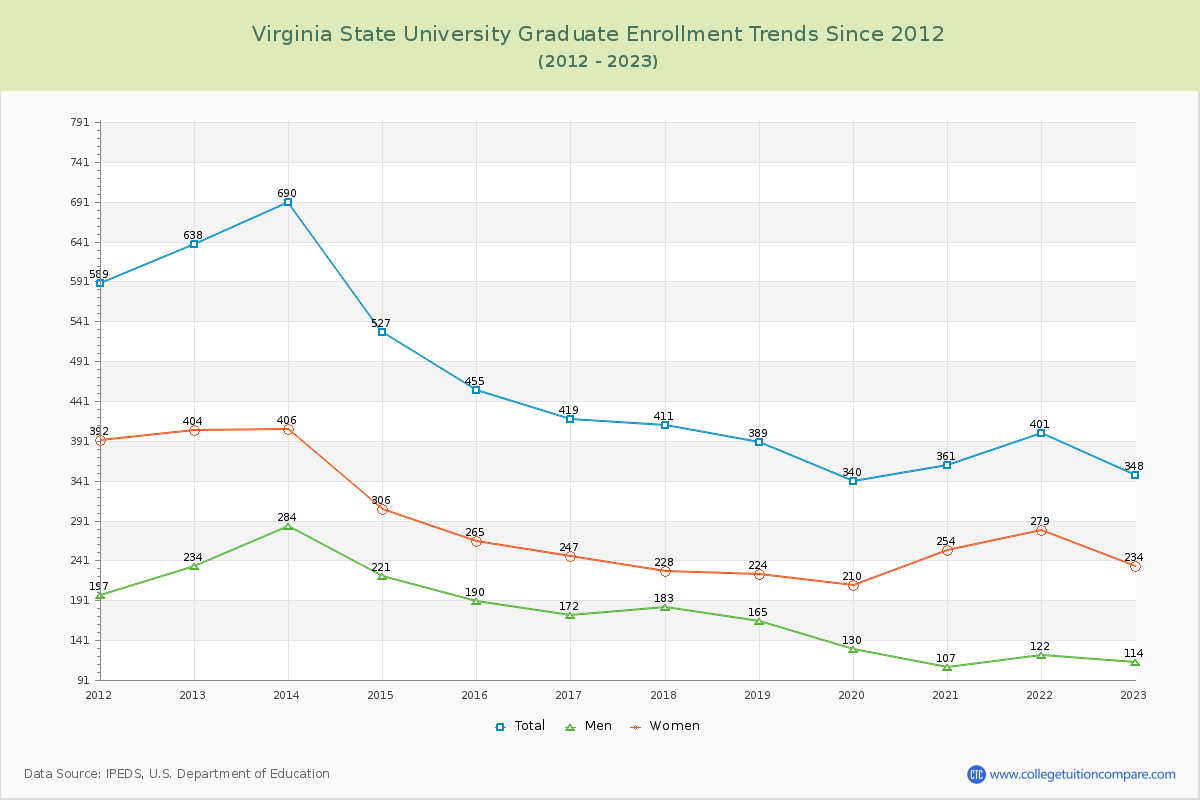
92.51% of total students is undergraduate students and 7.49% students is graduate students. The number of undergraduate students has decreased by 1,270 and the graduate enrollment has decreased by 290 over past 10 years.
The female to male ratio is 1.51 to 1 and it means that there are more female students enrolled in VSU than male students.
The following table and chart illustrate the changes in student population by gender at Virginia State University since 2012.
| Year | Total | Undergraduate | Graduate | ||||
|---|---|---|---|---|---|---|---|
| Total | Men | Women | Total | Men | Women | ||
| 2012-13 | 6,208 | 5,570 | 2,204 | 3,366 | 638 | 234 | 404 |
| 2013-14 | 5,763 -445 | 5,073 -497 | 2,033 -171 | 3,040 -326 | 690 52 | 284 50 | 406 2 |
| 2014-15 | 5,025 -738 | 4,498 -575 | 1,807 -226 | 2,691 -349 | 527 -163 | 221 -63 | 306 -100 |
| 2015-16 | 4,696 -329 | 4,241 -257 | 1,785 -22 | 2,456 -235 | 455 -72 | 190 -31 | 265 -41 |
| 2016-17 | 4,584 -112 | 4,165 -76 | 1,773 -12 | 2,392 -64 | 419 -36 | 172 -18 | 247 -18 |
| 2017-18 | 4,713 129 | 4,302 137 | 1,833 60 | 2,469 77 | 411 -8 | 183 11 | 228 -19 |
| 2018-19 | 4,385 -328 | 3,996 -306 | 1,701 -132 | 2,295 -174 | 389 -22 | 165 -18 | 224 -4 |
| 2019-20 | 4,365 -20 | 4,025 29 | 1,672 -29 | 2,353 58 | 340 -49 | 130 -35 | 210 -14 |
| 2020-21 | 4,020 -345 | 3,659 -366 | 1,450 -222 | 2,209 -144 | 361 21 | 107 -23 | 254 44 |
| 2021-22 | 4,300 280 | 3,899 240 | 1,562 112 | 2,337 128 | 401 40 | 122 15 | 279 25 |
| 2022-23 | 4,648 348 | 4,300 401 | 1,737 175 | 2,563 226 | 348 -53 | 114 -8 | 234 -45 |
| Average | 4,792 | 4,339 | 1,778 | 2,561 | 453 | 175 | 278 |