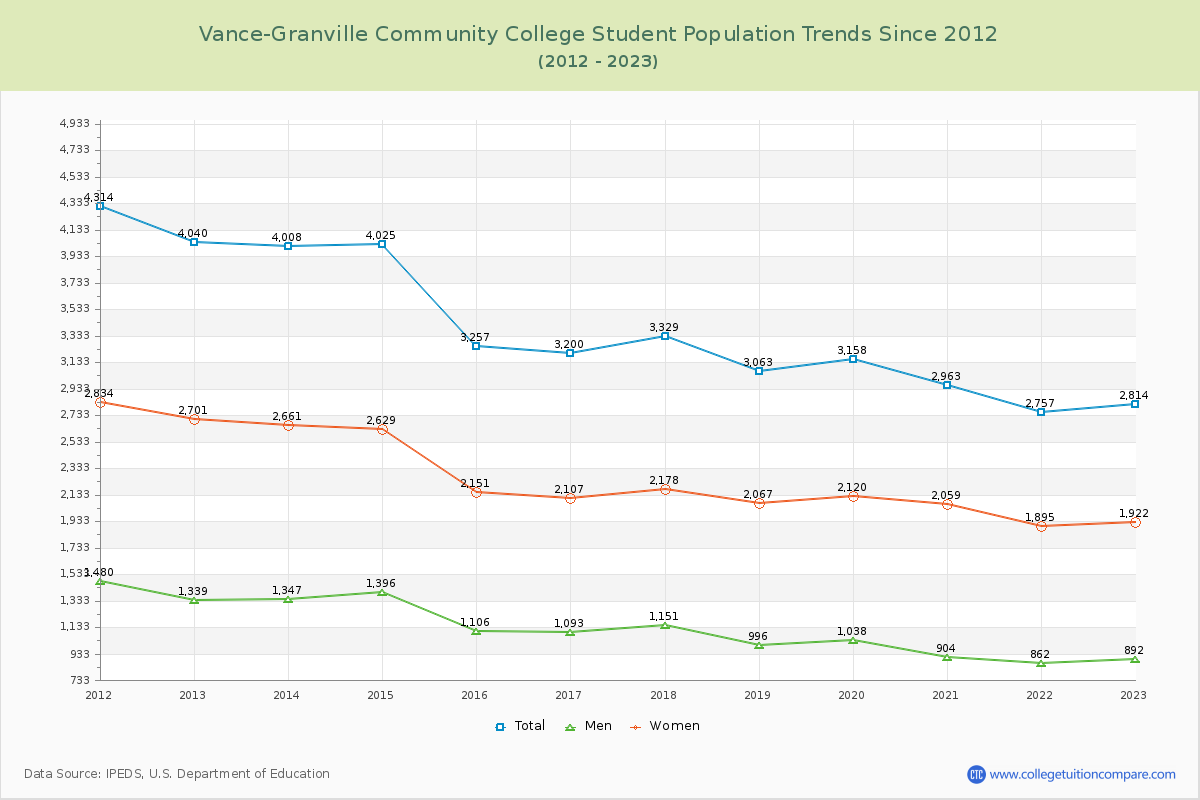
Student Population Changes
The average student population over the last 12 years is 3,329 where 2,814 students are attending the school for the academic year 2022-2023.
The female to male ratio is 2.15 to 1 and it means that there are far more female students enrolled in Vance-Granville CC than male students.
The following table and chart illustrate the changes in student population by gender at Vance-Granville Community College since 2012.
| Year | Total | Men | Women |
|---|---|---|---|
| 2012-13 | 4,040 | 1,339 | 2,701 |
| 2013-14 | 4,008 -32 | 1,347 8 | 2,661 -40 |
| 2014-15 | 4,025 17 | 1,396 49 | 2,629 -32 |
| 2015-16 | 3,257 -768 | 1,106 -290 | 2,151 -478 |
| 2016-17 | 3,200 -57 | 1,093 -13 | 2,107 -44 |
| 2017-18 | 3,329 129 | 1,151 58 | 2,178 71 |
| 2018-19 | 3,063 -266 | 996 -155 | 2,067 -111 |
| 2019-20 | 3,158 95 | 1,038 42 | 2,120 53 |
| 2020-21 | 2,963 -195 | 904 -134 | 2,059 -61 |
| 2021-22 | 2,757 -206 | 862 -42 | 1,895 -164 |
| 2022-23 | 2,814 57 | 892 30 | 1,922 27 |
| Average | 3,329 | 1,102 | 2,226 |