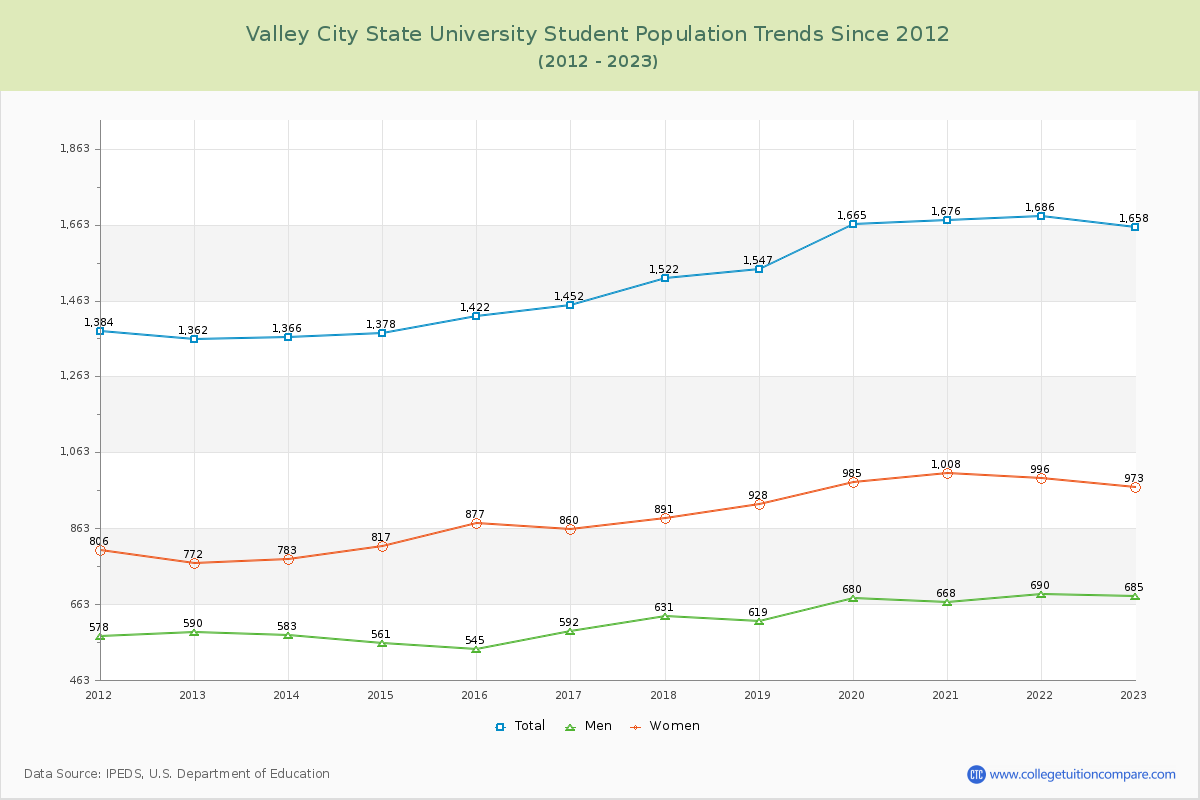
Student Population Changes
The average student population over the last 12 years is 1,521 where 1,658 students are attending the school for the academic year 2022-2023.
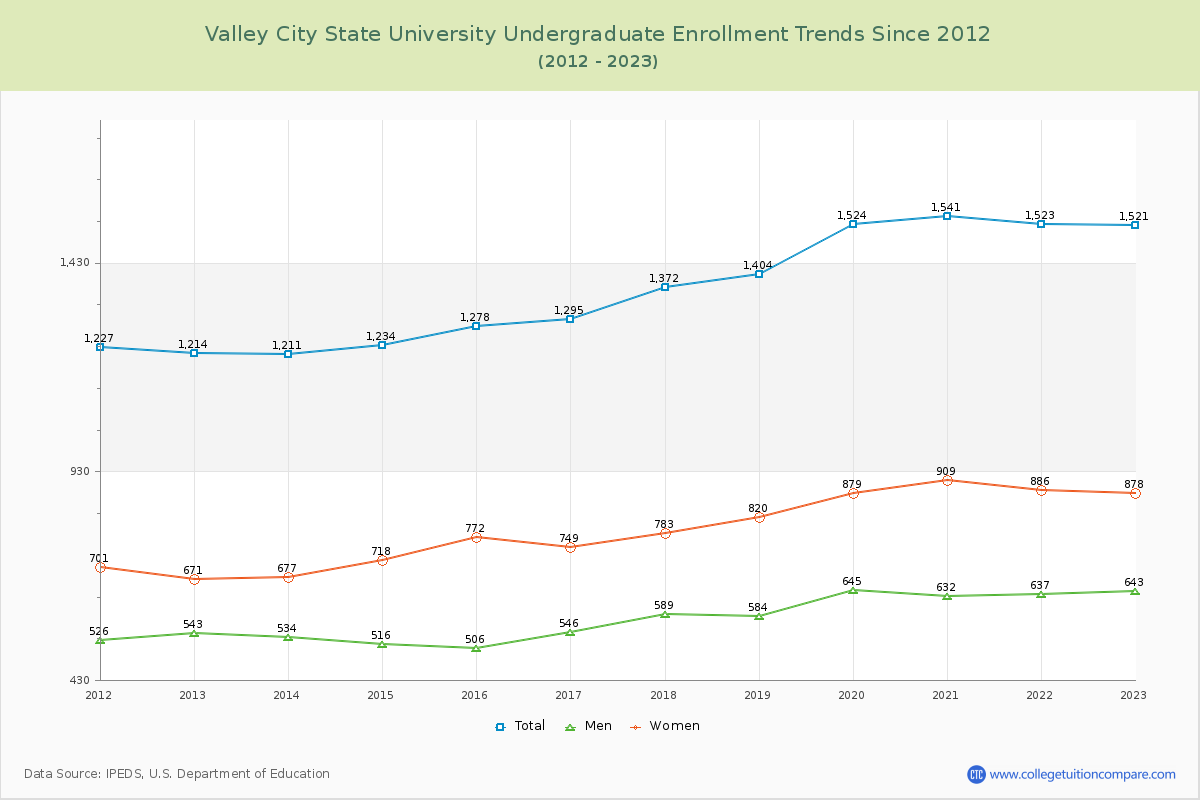
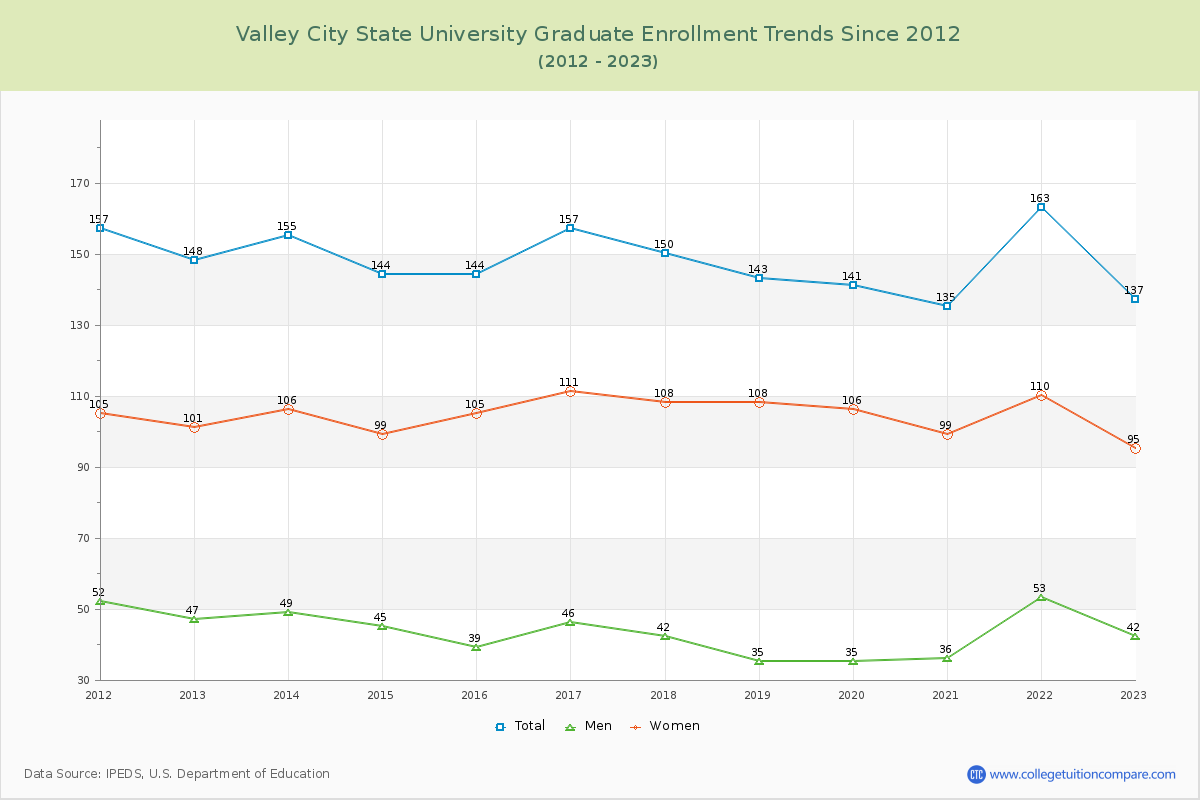
91.74% of total students is undergraduate students and 8.26% students is graduate students. The number of undergraduate students has increased by 307 and the graduate enrollment has decreased by 11 over past 10 years.
The female to male ratio is 1.42 to 1 and it means that there are more female students enrolled in Valley City State than male students.
The following table and chart illustrate the changes in student population by gender at Valley City State University since 2012.
| Year | Total | Undergraduate | Graduate | ||||
|---|---|---|---|---|---|---|---|
| Total | Men | Women | Total | Men | Women | ||
| 2012-13 | 1,362 | 1,214 | 543 | 671 | 148 | 47 | 101 |
| 2013-14 | 1,366 4 | 1,211 -3 | 534 -9 | 677 6 | 155 7 | 49 2 | 106 5 |
| 2014-15 | 1,378 12 | 1,234 23 | 516 -18 | 718 41 | 144 -11 | 45 -4 | 99 -7 |
| 2015-16 | 1,422 44 | 1,278 44 | 506 -10 | 772 54 | 144 0 | 39 -6 | 105 6 |
| 2016-17 | 1,452 30 | 1,295 17 | 546 40 | 749 -23 | 157 13 | 46 7 | 111 6 |
| 2017-18 | 1,522 70 | 1,372 77 | 589 43 | 783 34 | 150 -7 | 42 -4 | 108 -3 |
| 2018-19 | 1,547 25 | 1,404 32 | 584 -5 | 820 37 | 143 -7 | 35 -7 | 108 0 |
| 2019-20 | 1,665 118 | 1,524 120 | 645 61 | 879 59 | 141 -2 | 35 0 | 106 -2 |
| 2020-21 | 1,676 11 | 1,541 17 | 632 -13 | 909 30 | 135 -6 | 36 1 | 99 -7 |
| 2021-22 | 1,686 10 | 1,523 -18 | 637 5 | 886 -23 | 163 28 | 53 17 | 110 11 |
| 2022-23 | 1,658 -28 | 1,521 -2 | 643 6 | 878 -8 | 137 -26 | 42 -11 | 95 -15 |
| Average | 1,521 | 1,374 | 580 | 795 | 147 | 43 | 104 |