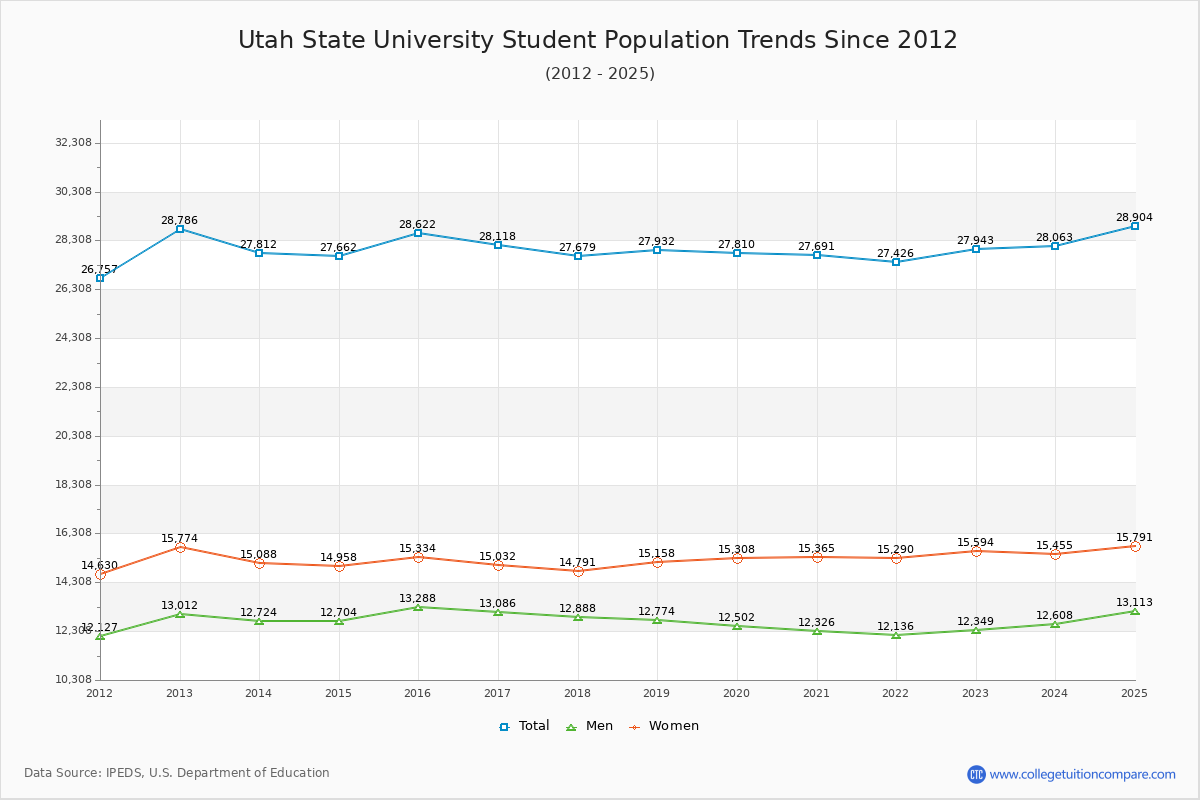
Student Population Changes
The average student population over the last 12 years is 27,953 where 27,943 students are attending the school for the academic year 2022-2023.
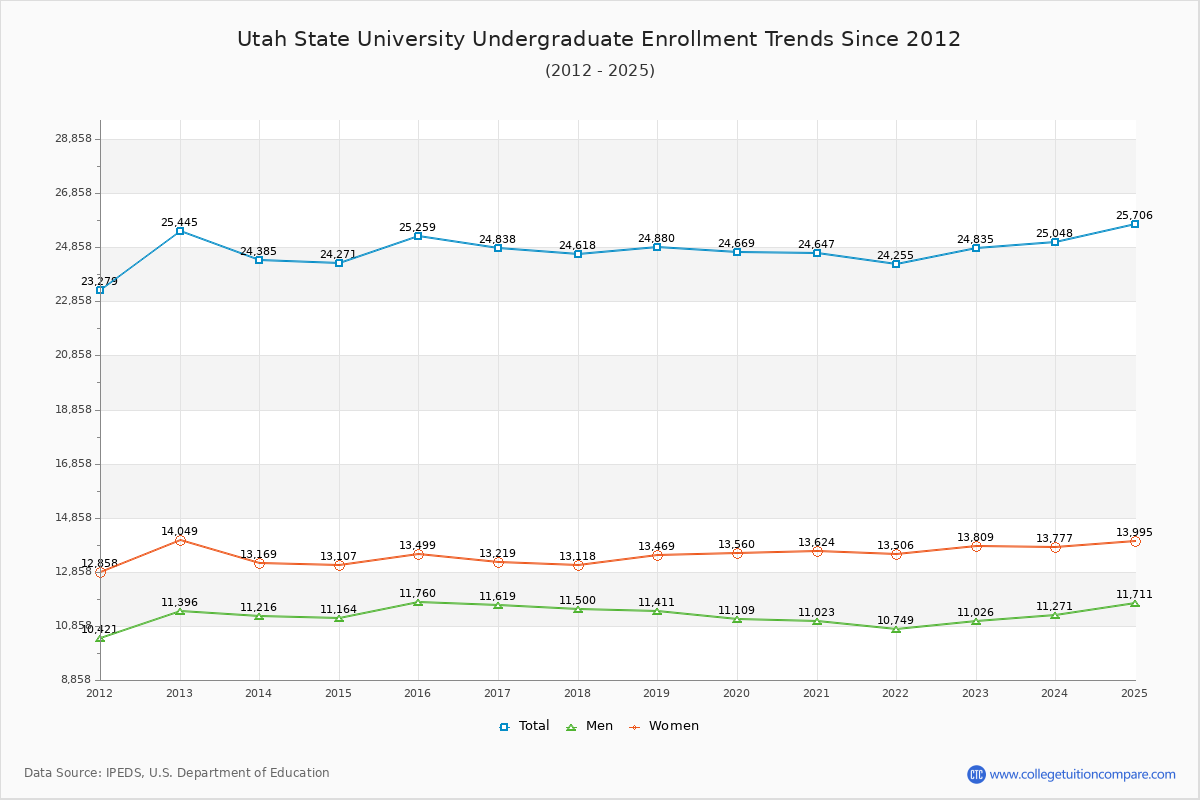
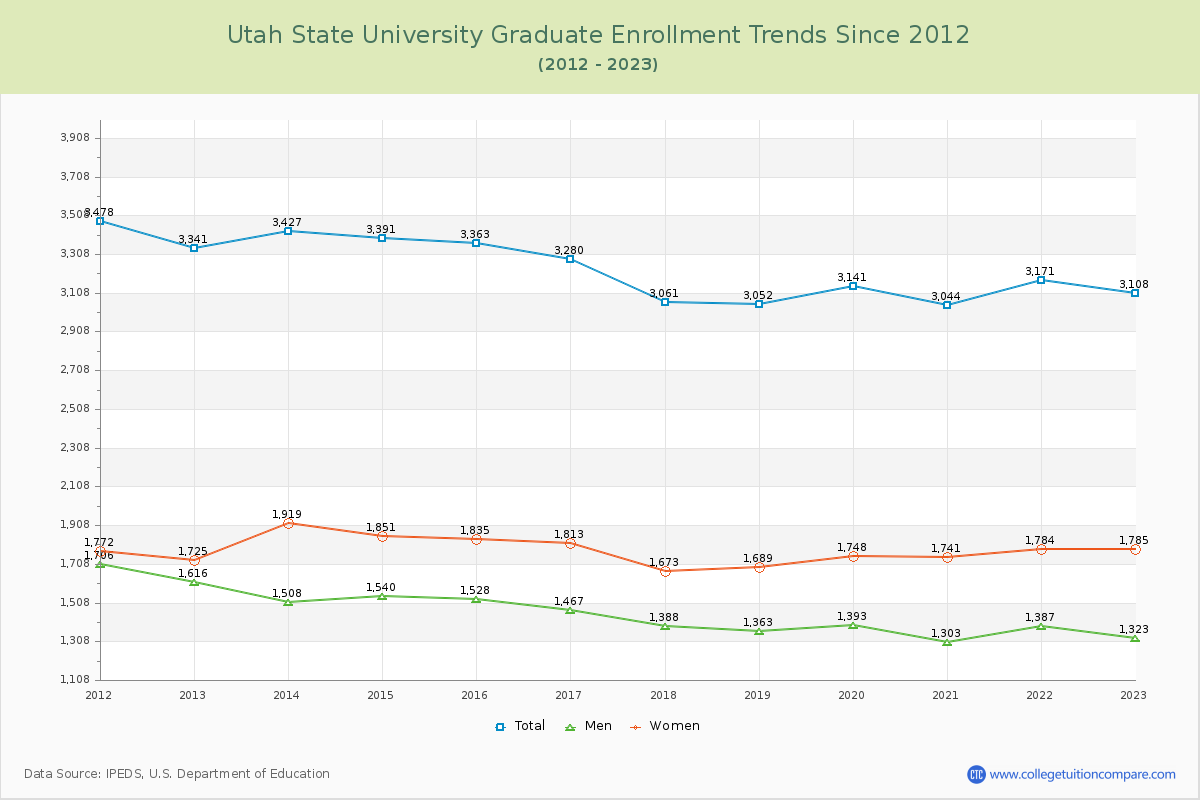
88.88% of total students is undergraduate students and 11.12% students is graduate students. The number of undergraduate students has decreased by 610 and the graduate enrollment has decreased by 233 over past 10 years.
The female to male ratio is 1.26 to 1 and it means that there are slightly more female students enrolled in Utah State than male students.
The following table and chart illustrate the changes in student population by gender at Utah State University since 2012.
| Year | Total | Undergraduate | Graduate | ||||
|---|---|---|---|---|---|---|---|
| Total | Men | Women | Total | Men | Women | ||
| 2012-13 | 28,786 | 25,445 | 11,396 | 14,049 | 3,341 | 1,616 | 1,725 |
| 2013-14 | 27,812 -974 | 24,385 -1,060 | 11,216 -180 | 13,169 -880 | 3,427 86 | 1,508 -108 | 1,919 194 |
| 2014-15 | 27,662 -150 | 24,271 -114 | 11,164 -52 | 13,107 -62 | 3,391 -36 | 1,540 32 | 1,851 -68 |
| 2015-16 | 28,622 960 | 25,259 988 | 11,760 596 | 13,499 392 | 3,363 -28 | 1,528 -12 | 1,835 -16 |
| 2016-17 | 28,118 -504 | 24,838 -421 | 11,619 -141 | 13,219 -280 | 3,280 -83 | 1,467 -61 | 1,813 -22 |
| 2017-18 | 27,679 -439 | 24,618 -220 | 11,500 -119 | 13,118 -101 | 3,061 -219 | 1,388 -79 | 1,673 -140 |
| 2018-19 | 27,932 253 | 24,880 262 | 11,411 -89 | 13,469 351 | 3,052 -9 | 1,363 -25 | 1,689 16 |
| 2019-20 | 27,810 -122 | 24,669 -211 | 11,109 -302 | 13,560 91 | 3,141 89 | 1,393 30 | 1,748 59 |
| 2020-21 | 27,691 -119 | 24,647 -22 | 11,023 -86 | 13,624 64 | 3,044 -97 | 1,303 -90 | 1,741 -7 |
| 2021-22 | 27,426 -265 | 24,255 -392 | 10,749 -274 | 13,506 -118 | 3,171 127 | 1,387 84 | 1,784 43 |
| 2022-23 | 27,943 517 | 24,835 580 | 11,026 277 | 13,809 303 | 3,108 -63 | 1,323 -64 | 1,785 1 |
| Average | 27,953 | 24,737 | 11,270 | 13,466 | 3,216 | 1,438 | 1,778 |