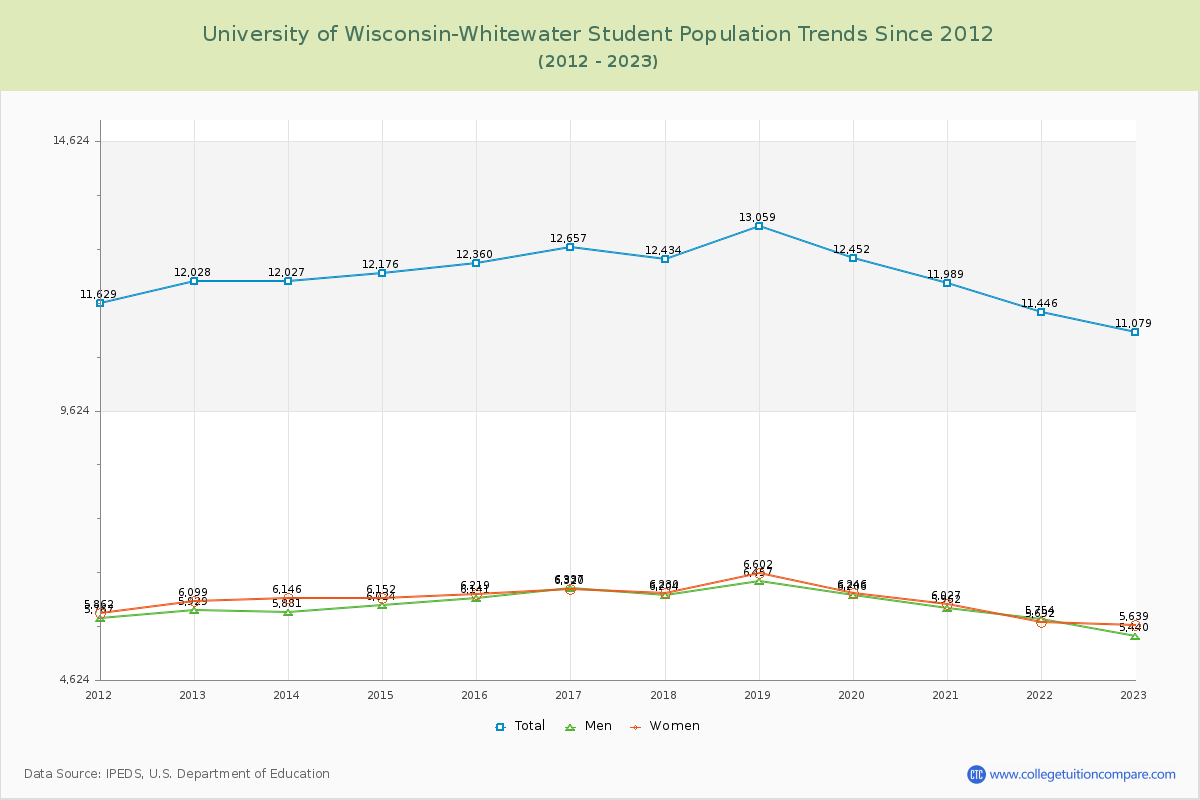
Student Population Changes
The average student population over the last 12 years is 12,155 where 11,079 students are attending the school for the academic year 2022-2023.
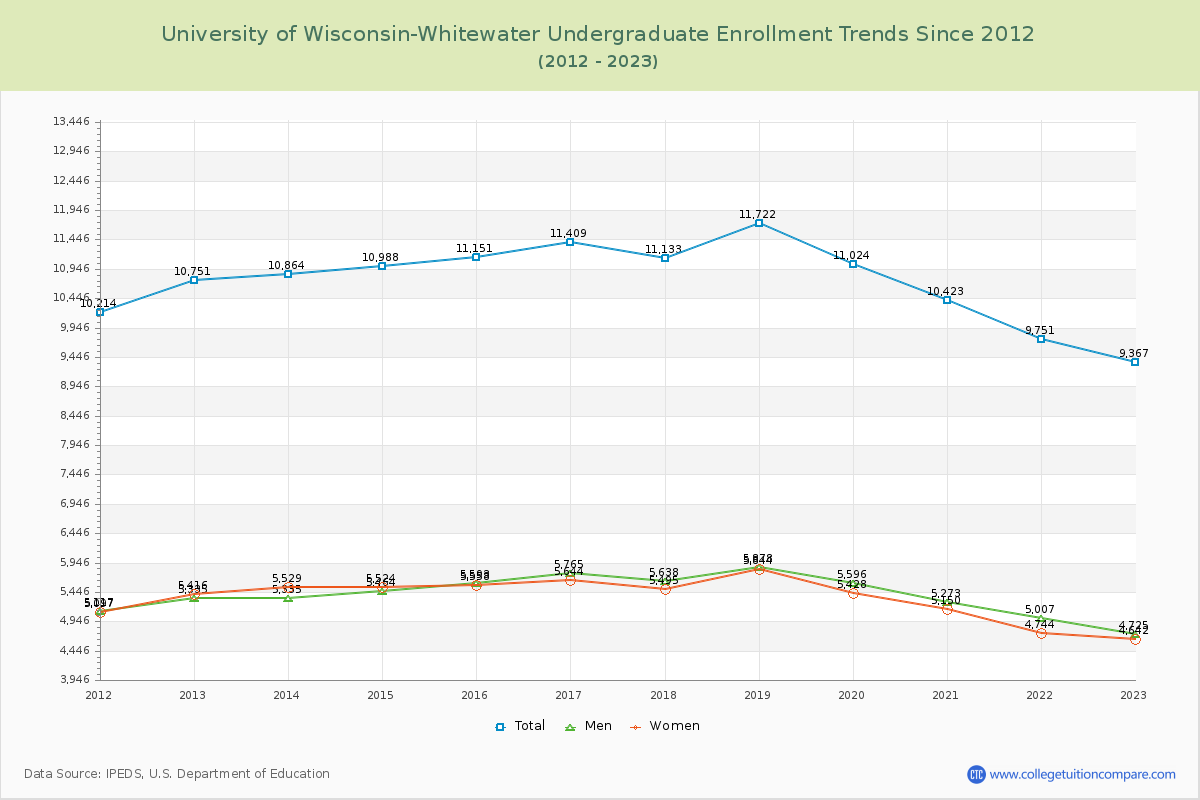
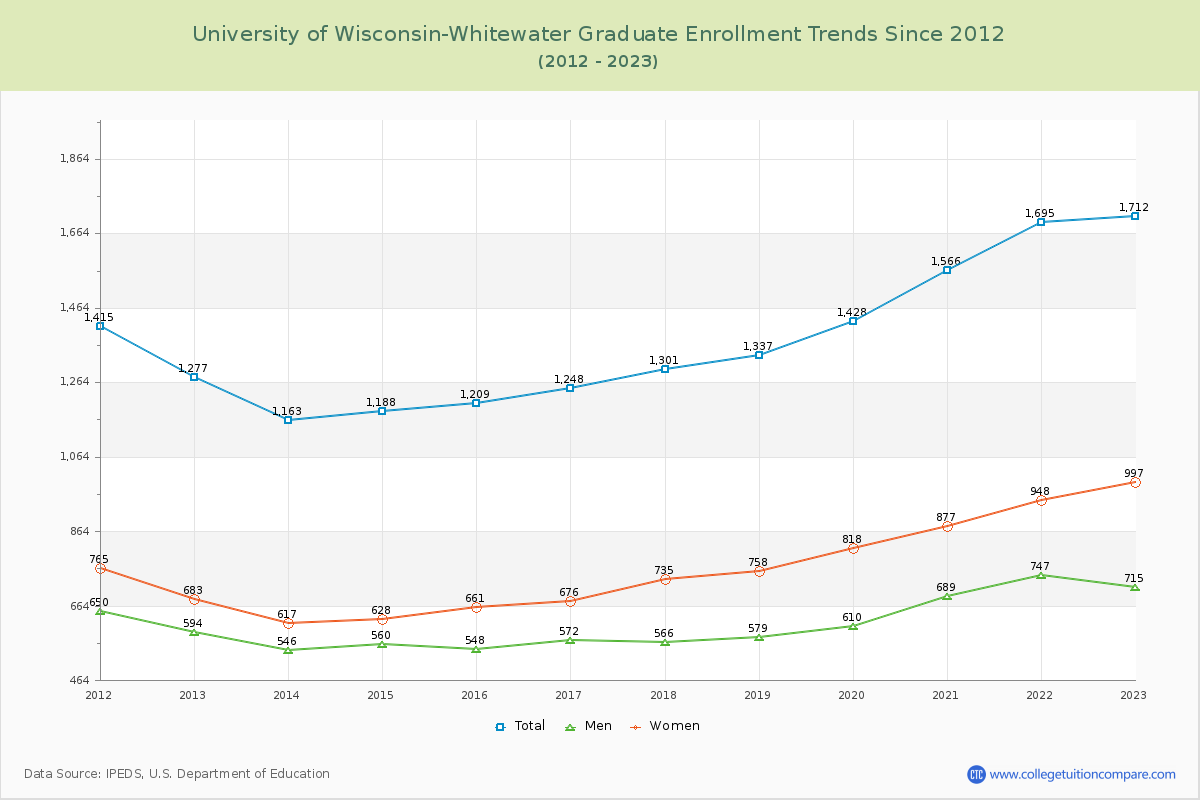
84.55% of total students is undergraduate students and 15.45% students is graduate students. The number of undergraduate students has decreased by 1,384 and the graduate enrollment has increased by 435 over past 10 years.
The female to male ratio is 1.04 to 1 and it means that there are similar numbers of female and male students enrolled in U of Wisconsin-Whitewater.
The following table and chart illustrate the changes in student population by gender at University of Wisconsin-Whitewater since 2012.
| Year | Total | Undergraduate | Graduate | ||||
|---|---|---|---|---|---|---|---|
| Total | Men | Women | Total | Men | Women | ||
| 2012-13 | 12,028 | 10,751 | 5,335 | 5,416 | 1,277 | 594 | 683 |
| 2013-14 | 12,027 -1 | 10,864 113 | 5,335 0 | 5,529 113 | 1,163 -114 | 546 -48 | 617 -66 |
| 2014-15 | 12,176 149 | 10,988 124 | 5,464 129 | 5,524 -5 | 1,188 25 | 560 14 | 628 11 |
| 2015-16 | 12,360 184 | 11,151 163 | 5,593 129 | 5,558 34 | 1,209 21 | 548 -12 | 661 33 |
| 2016-17 | 12,657 297 | 11,409 258 | 5,765 172 | 5,644 86 | 1,248 39 | 572 24 | 676 15 |
| 2017-18 | 12,434 -223 | 11,133 -276 | 5,638 -127 | 5,495 -149 | 1,301 53 | 566 -6 | 735 59 |
| 2018-19 | 13,059 625 | 11,722 589 | 5,878 240 | 5,844 349 | 1,337 36 | 579 13 | 758 23 |
| 2019-20 | 12,452 -607 | 11,024 -698 | 5,596 -282 | 5,428 -416 | 1,428 91 | 610 31 | 818 60 |
| 2020-21 | 11,989 -463 | 10,423 -601 | 5,273 -323 | 5,150 -278 | 1,566 138 | 689 79 | 877 59 |
| 2021-22 | 11,446 -543 | 9,751 -672 | 5,007 -266 | 4,744 -406 | 1,695 129 | 747 58 | 948 71 |
| 2022-23 | 11,079 -367 | 9,367 -384 | 4,725 -282 | 4,642 -102 | 1,712 17 | 715 -32 | 997 49 |
| Average | 12,155 | 10,780 | 5,419 | 5,361 | 1,375 | 611 | 763 |