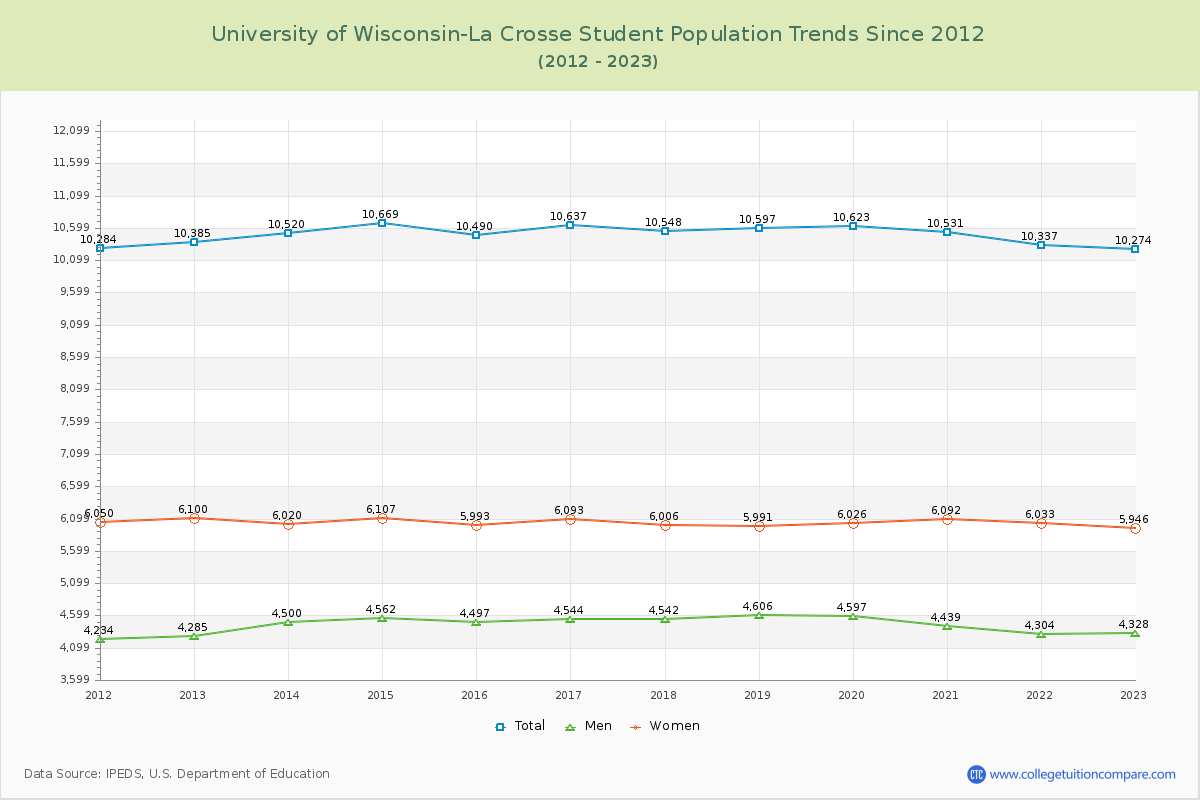
Student Population Changes
The average student population over the last 12 years is 10,510 where 10,274 students are attending the school for the academic year 2022-2023.
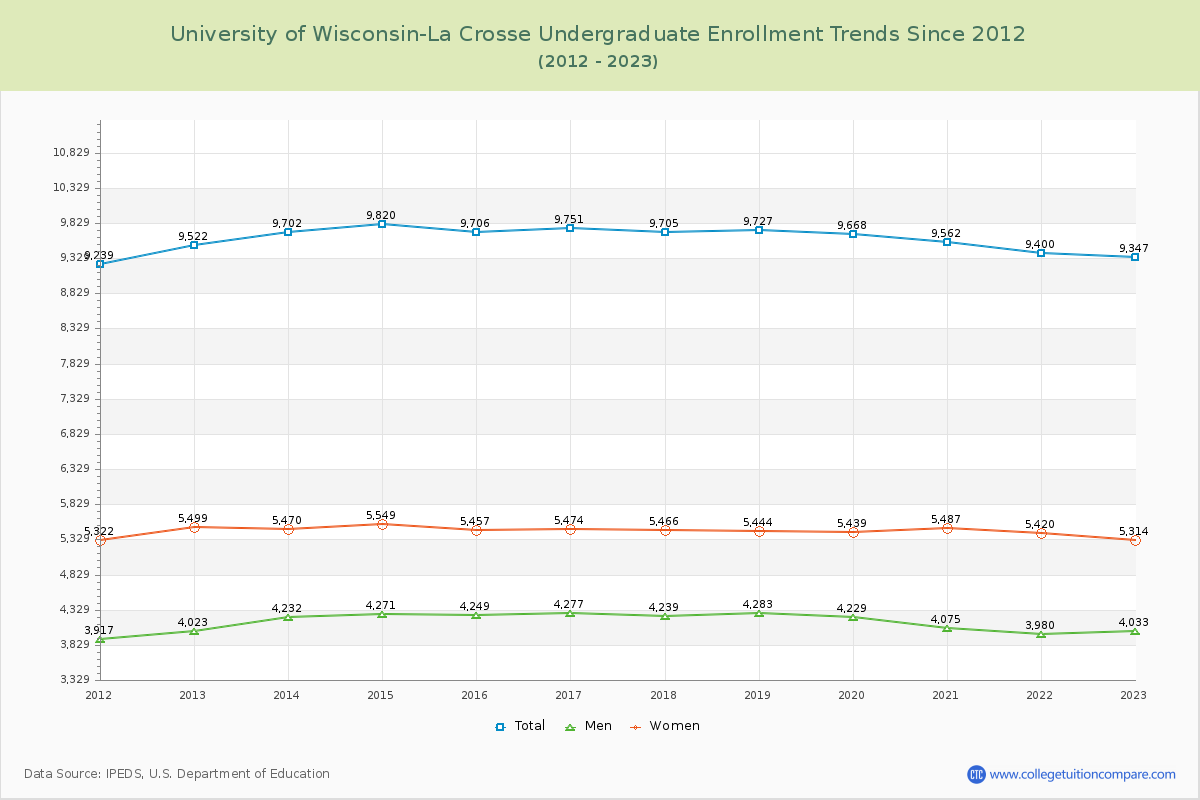
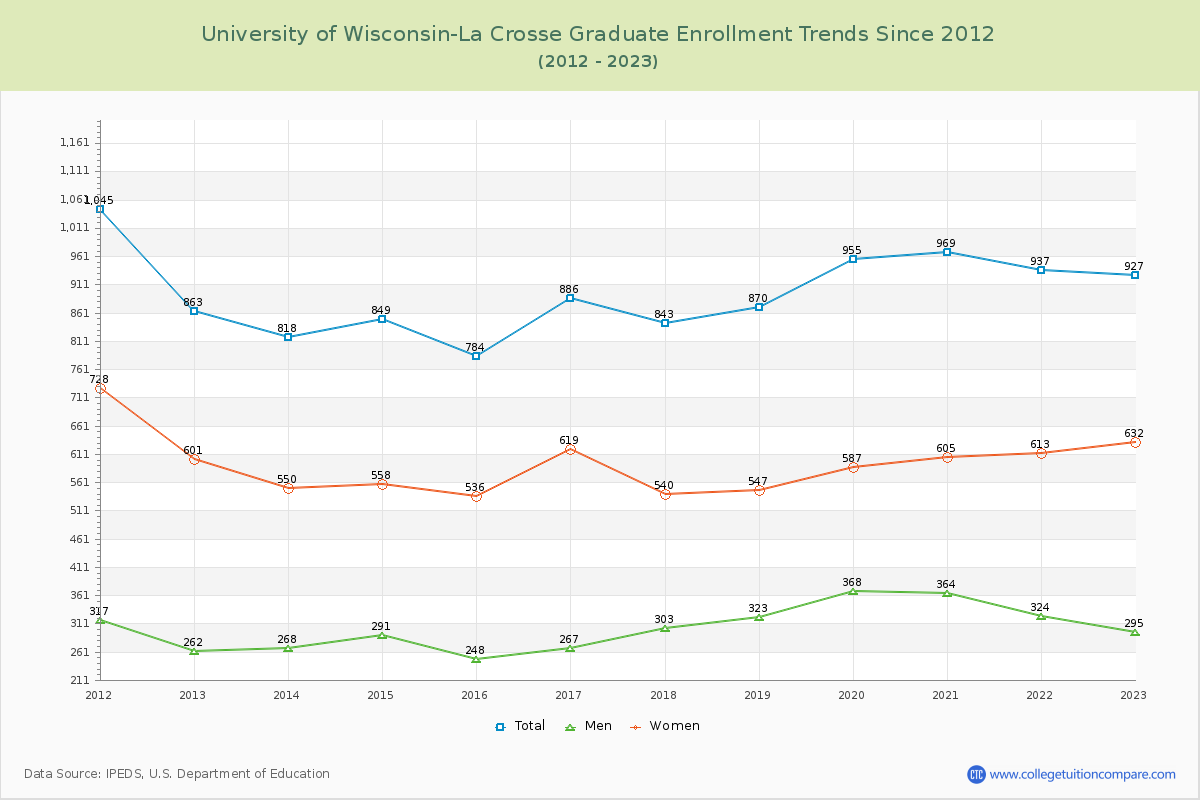
90.98% of total students is undergraduate students and 9.02% students is graduate students. The number of undergraduate students has decreased by 175 and the graduate enrollment has increased by 64 over past 10 years.
The female to male ratio is 1.37 to 1 and it means that there are more female students enrolled in U of Wisconsin-La Crosse than male students.
The following table and chart illustrate the changes in student population by gender at University of Wisconsin-La Crosse since 2012.
| Year | Total | Undergraduate | Graduate | ||||
|---|---|---|---|---|---|---|---|
| Total | Men | Women | Total | Men | Women | ||
| 2012-13 | 10,385 | 9,522 | 4,023 | 5,499 | 863 | 262 | 601 |
| 2013-14 | 10,520 135 | 9,702 180 | 4,232 209 | 5,470 -29 | 818 -45 | 268 6 | 550 -51 |
| 2014-15 | 10,669 149 | 9,820 118 | 4,271 39 | 5,549 79 | 849 31 | 291 23 | 558 8 |
| 2015-16 | 10,490 -179 | 9,706 -114 | 4,249 -22 | 5,457 -92 | 784 -65 | 248 -43 | 536 -22 |
| 2016-17 | 10,637 147 | 9,751 45 | 4,277 28 | 5,474 17 | 886 102 | 267 19 | 619 83 |
| 2017-18 | 10,548 -89 | 9,705 -46 | 4,239 -38 | 5,466 -8 | 843 -43 | 303 36 | 540 -79 |
| 2018-19 | 10,597 49 | 9,727 22 | 4,283 44 | 5,444 -22 | 870 27 | 323 20 | 547 7 |
| 2019-20 | 10,623 26 | 9,668 -59 | 4,229 -54 | 5,439 -5 | 955 85 | 368 45 | 587 40 |
| 2020-21 | 10,531 -92 | 9,562 -106 | 4,075 -154 | 5,487 48 | 969 14 | 364 -4 | 605 18 |
| 2021-22 | 10,337 -194 | 9,400 -162 | 3,980 -95 | 5,420 -67 | 937 -32 | 324 -40 | 613 8 |
| 2022-23 | 10,274 -63 | 9,347 -53 | 4,033 53 | 5,314 -106 | 927 -10 | 295 -29 | 632 19 |
| Average | 10,510 | 9,628 | 4,172 | 5,456 | 882 | 301 | 581 |