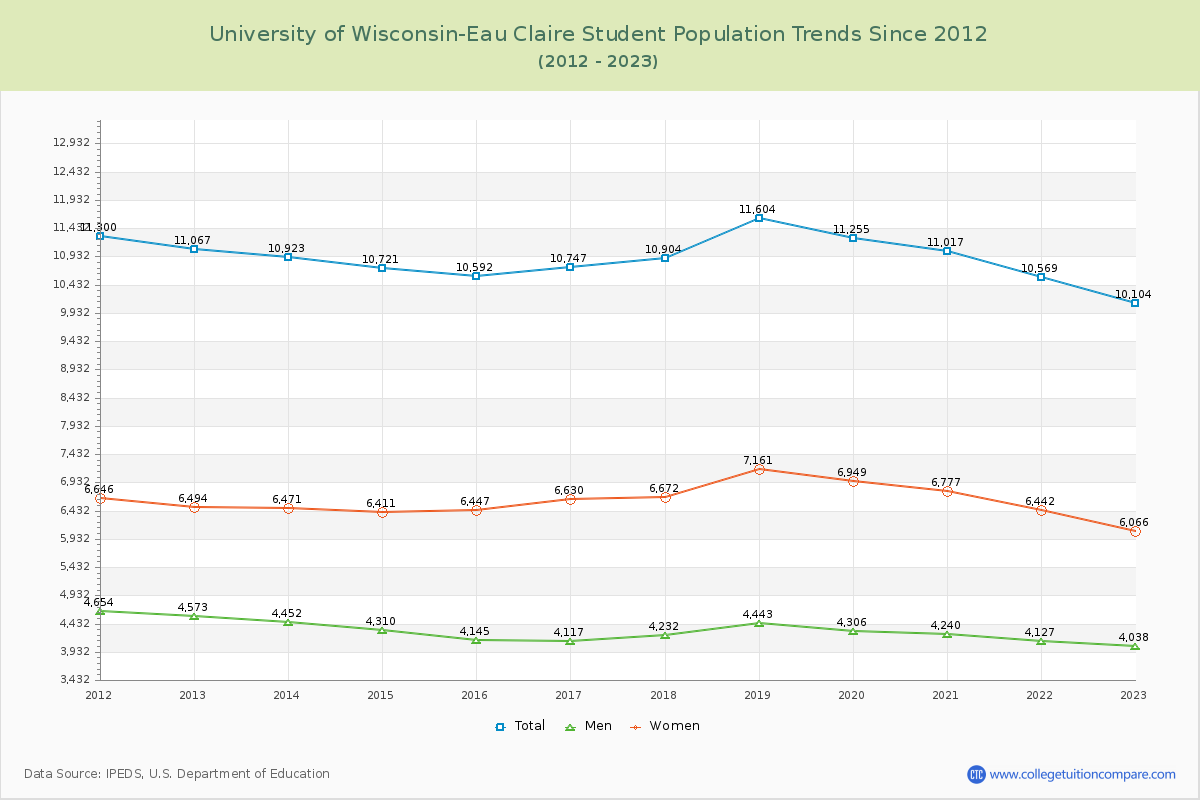
Student Population Changes
The average student population over the last 12 years is 10,864 where 10,104 students are attending the school for the academic year 2022-2023.
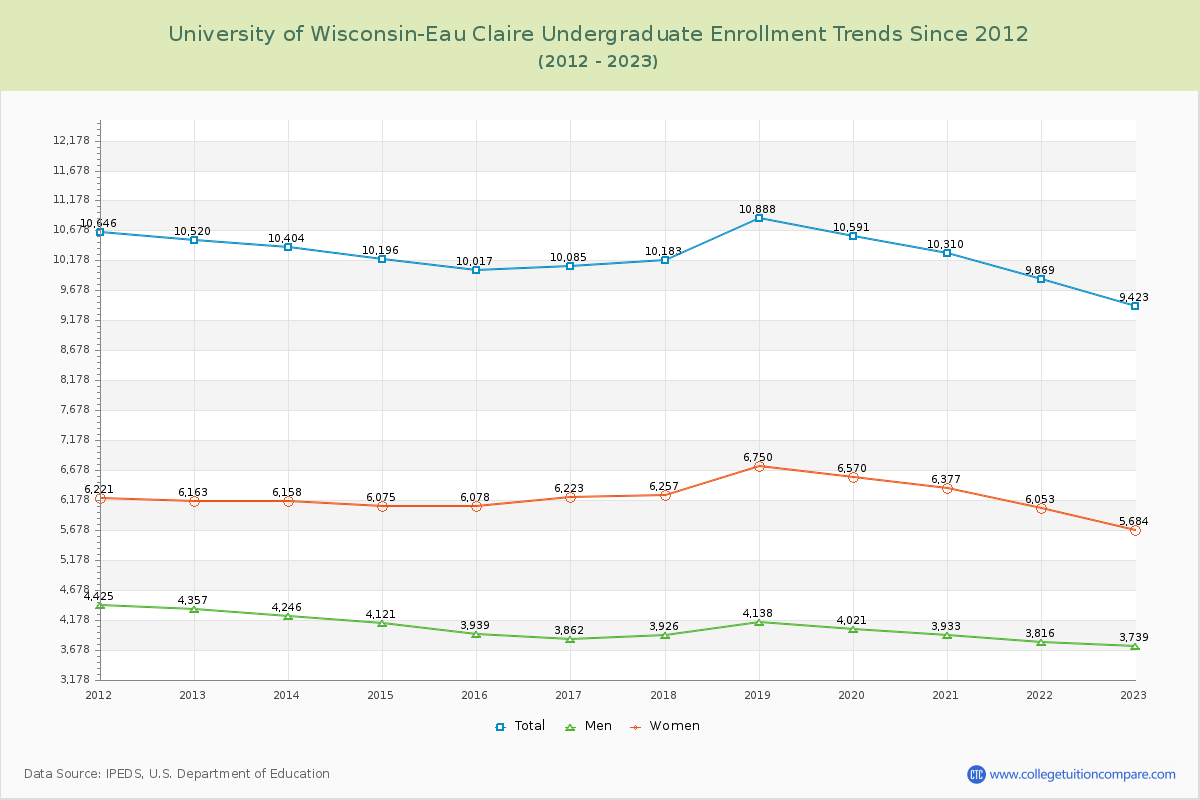
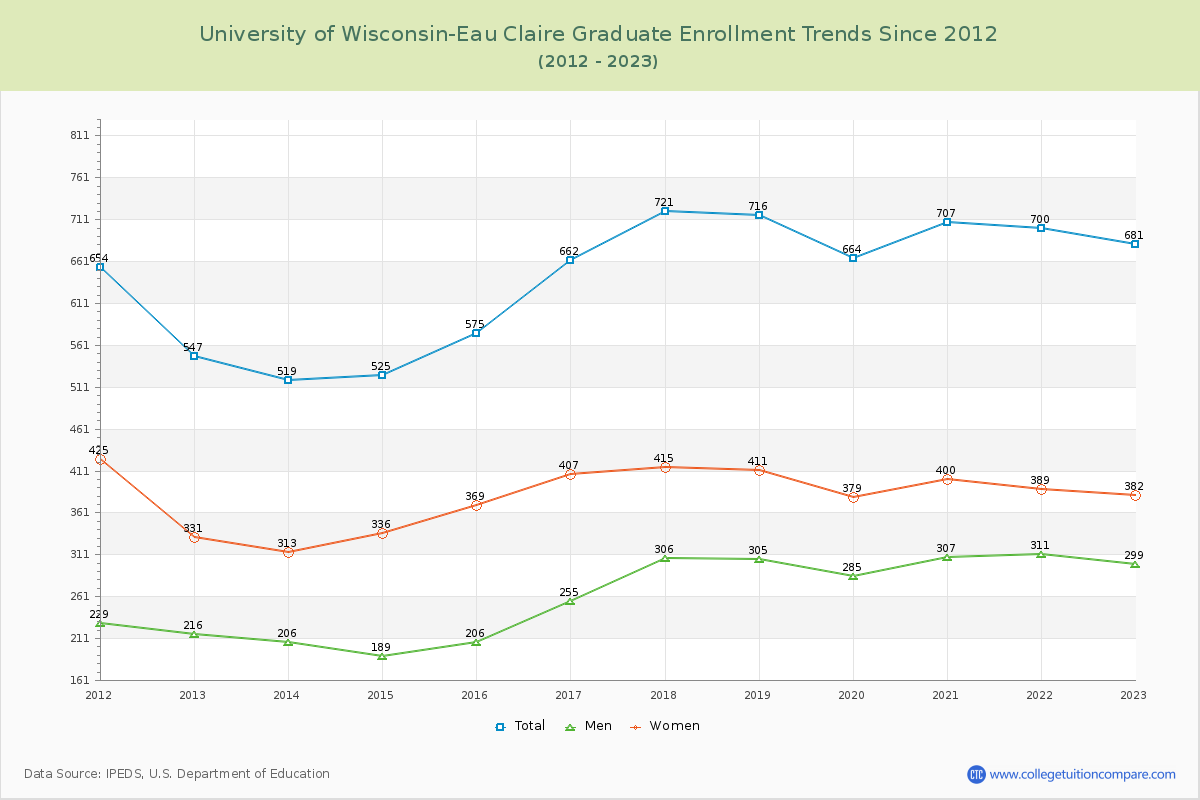
93.26% of total students is undergraduate students and 6.74% students is graduate students. The number of undergraduate students has decreased by 1,097 and the graduate enrollment has increased by 134 over past 10 years.
The female to male ratio is 1.50 to 1 and it means that there are more female students enrolled in U of Wisconsin-Eau Claire than male students.
The following table and chart illustrate the changes in student population by gender at University of Wisconsin-Eau Claire since 2012.
| Year | Total | Undergraduate | Graduate | ||||
|---|---|---|---|---|---|---|---|
| Total | Men | Women | Total | Men | Women | ||
| 2012-13 | 11,067 | 10,520 | 4,357 | 6,163 | 547 | 216 | 331 |
| 2013-14 | 10,923 -144 | 10,404 -116 | 4,246 -111 | 6,158 -5 | 519 -28 | 206 -10 | 313 -18 |
| 2014-15 | 10,721 -202 | 10,196 -208 | 4,121 -125 | 6,075 -83 | 525 6 | 189 -17 | 336 23 |
| 2015-16 | 10,592 -129 | 10,017 -179 | 3,939 -182 | 6,078 3 | 575 50 | 206 17 | 369 33 |
| 2016-17 | 10,747 155 | 10,085 68 | 3,862 -77 | 6,223 145 | 662 87 | 255 49 | 407 38 |
| 2017-18 | 10,904 157 | 10,183 98 | 3,926 64 | 6,257 34 | 721 59 | 306 51 | 415 8 |
| 2018-19 | 11,604 700 | 10,888 705 | 4,138 212 | 6,750 493 | 716 -5 | 305 -1 | 411 -4 |
| 2019-20 | 11,255 -349 | 10,591 -297 | 4,021 -117 | 6,570 -180 | 664 -52 | 285 -20 | 379 -32 |
| 2020-21 | 11,017 -238 | 10,310 -281 | 3,933 -88 | 6,377 -193 | 707 43 | 307 22 | 400 21 |
| 2021-22 | 10,569 -448 | 9,869 -441 | 3,816 -117 | 6,053 -324 | 700 -7 | 311 4 | 389 -11 |
| 2022-23 | 10,104 -465 | 9,423 -446 | 3,739 -77 | 5,684 -369 | 681 -19 | 299 -12 | 382 -7 |
| Average | 10,864 | 10,226 | 4,009 | 6,217 | 638 | 262 | 376 |